Measuring loyalty programme success is defined as calculating the incremental profit your programme generates above what those customers would have spent anyway, not simply totalling up member revenue. Most small business owners track the wrong numbers, which means they either overestimate how well their programme is working or miss early warning signs that it is failing. Deloitte’s 2025 Consumer Loyalty Programme Survey found that 72% of consumers say loyalty programmes increase their spend with a brand. That figure sounds encouraging, but it tells you nothing about whether your programme is actually profitable. This guide gives you a finance-defensible framework to assess loyalty programme performance accurately, using the same methods applied by analysts at firms like KYROS and Antavo.
Which financial metrics best reflect loyalty programme success?
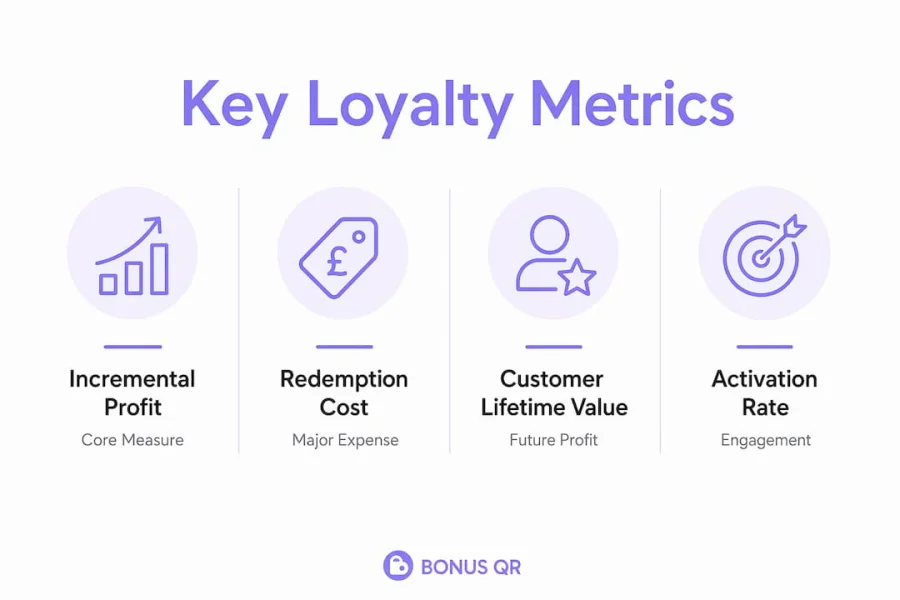
The single most common error in loyalty programme measurement is treating total member revenue as proof of success. Members who join your programme were often already your best customers. Crediting all of their spending to the programme overstates its impact significantly. Incremental profit is the correct measure: the net profit generated by members above what a comparable non-member group would have produced, minus all programme costs.

The ROI formula that actually holds up
The correct ROI formula for a loyalty programme is: incremental net profit divided by total programme costs, expressed as a percentage. Total programme costs include technology fees, reward fulfilment, staff time, and marketing spend. If your incremental net profit is £12,000 and your total costs are £8,000, your ROI is 50%. That is a number you can defend to a bank manager or a business partner.
Customer Lifetime Value (CLV) and Expected Future Profit (EFP) are the two predictive metrics that sit beneath this formula. CLV measures the total net profit you expect from a customer over their relationship with your business. EFP adjusts CLV to account for the cost of rewards that member will eventually redeem. CLV net of redemption costs reflects true incremental profit and is the most reliable single number for evaluating loyalty programme effectiveness over time.
Why redemption cost forecasting matters more than you think
Redemption is typically the largest variable expense in any loyalty programme, and most small businesses underestimate it. The standard mistake is applying an average breakage rate across all members. Breakage is the percentage of earned points or stamps that are never redeemed. Using a single average figure distorts your cost projections because member behaviour varies enormously. Redemption cost models should forecast at the individual member level, grouping customers by their actual earning and redemption patterns.
A small, highly engaged segment of your members will drive the majority of redemptions. If you model costs using the average across all members, you will underestimate the liability created by that top segment. This leads to ROI figures that look healthy on paper but collapse when the redemption bill arrives. Segmenting members by redemption behaviour before you build your financial model is not optional. It is the difference between a forecast you can rely on and one that misleads you.
Pro Tip: Align your financial measurements with your programme design from day one. A stamp card programme has different cost drivers than a points programme. Build your ROI model around your specific reward structure, not a generic template.
| Metric | Role in measurement |
|---|---|
| Incremental net profit | The core success measure: profit above the non-member baseline, net of all costs |
| Programme ROI | Incremental net profit divided by total costs; the headline number for stakeholder reporting |
| Customer Lifetime Value (CLV) | Predicted total net profit per customer over their full relationship with your business |
| Expected Future Profit (EFP) | CLV adjusted for the cost of future reward redemptions; the most accurate long-term view |
| Redemption cost forecast | Projected reward fulfilment costs modelled at the individual member level, not as an average |
What operational KPIs indicate loyalty programme effectiveness?
Financial metrics tell you whether your programme is profitable. Operational KPIs tell you why, and where to intervene before problems become expensive. Tracking customer journey milestones at acquisition, activation, return, and redemption stages gives you a practical system for monitoring incremental CLV changes in real time.
Each milestone represents a transition point where a customer either deepens their relationship with your business or drifts away. Movement between these stages is the clearest signal you have that your programme is working or stalling. Monitoring milestone transitions within defined time windows is more useful than tracking arbitrary monthly totals.
The KPI ladder: four stages that matter
Acquisition measures how many customers enrol in your programme within a given period. This is your starting point, but it is the least informative metric on its own. A high enrolment rate with a low activation rate simply means you are signing up customers who never engage.
Activation measures the percentage of enrolled members who complete a qualifying action, such as earning their first stamp or making a second purchase, within a defined window. A 30-day activation rate below 40% is a reliable early warning that your onboarding experience needs attention.
Return rate measures how often activated members come back within a set period. This is where incremental CLV uplift becomes visible. A member who visits three times in 60 days is generating measurably more value than one who visits once.
Redemption rate measures the percentage of members who reach and use a reward. This milestone is the most direct indicator of perceived programme value. Operational KPIs tied to redemption behaviours, rather than just sign-ups, are where SMBs gain the most useful insight into programme health.
KPI groups: outcome, diagnostic, and leading indicators
KPI groups divide into three categories, each serving a different purpose. Outcome KPIs prove impact. Diagnostic KPIs explain why performance moved. Leading indicators flag changes early enough to act on them.
A minimum viable KPI set for an SMB loyalty programme includes:
- Enrolment rate: new members as a percentage of total customers in the period
- 30-day activation rate: members completing a first qualifying action within 30 days of joining
- 90-day return rate: activated members making a second visit within 90 days
- First redemption rate: percentage of members who reach and redeem their first reward
- Redemption frequency: average number of redemptions per active member per quarter
- Churn rate: percentage of previously active members with no activity in the past 90 days
Pro Tip: Use inflection points as early warnings. If your 30-day activation rate drops by more than 10 percentage points month on month, do not wait for the quarterly review. Investigate the onboarding experience immediately and test a single change before drawing conclusions.
How to build a measurement framework that withstands scrutiny
A measurement framework is only as reliable as its baseline. Without a comparison point, you cannot separate the effect of your loyalty programme from background trends in your business. The most defensible approach uses a counterfactual baseline: a group of comparable non-members measured over the same period as your programme members.
For most small businesses, a formal holdout group is the most practical method. You withhold programme invitations from a randomly selected segment of customers, then compare their purchasing behaviour against enrolled members over the same window. Incremental revenue is calculated as member revenue minus the control group baseline. This removes the revenue that would have happened regardless of the programme.
Steps to build a defensible measurement system
-
Define your measurement horizon before launch. Align your time window with your customers’ natural buying cycle. A coffee shop might use a 30-day window. A furniture retailer needs at least six months to see meaningful incremental behaviour.
-
Set up a control or matched non-member group. Select a segment of customers who are similar in spend history and visit frequency to your enrolled members. Track both groups from the same start date.
-
Run a 90-day pilot with clear success criteria. A 90-day pilot scoped to a defined member segment is the most reliable way to secure budget approval and test assumptions before committing to a full rollout. Define what success looks like before you start, not after.
-
Build three financial scenarios. Model conservative, base, and optimistic outcomes using your redemption cost forecasts and CLV estimates. This prepares you for stakeholder questions and prevents you from being caught out by a worse-than-expected redemption rate.
-
Segment members before modelling ROI. Divide your member base into at least three groups by engagement level. Apply separate redemption cost assumptions to each group. This prevents your top redeemers from distorting the overall model.
-
Review assumptions quarterly. Your programme data will reveal patterns that your initial model did not anticipate. Revisit your breakage assumptions, activation benchmarks, and CLV estimates every 90 days and update your model accordingly.
| Measurement approach | Reliability | Best suited for |
|---|---|---|
| Total member revenue | Low: overstates programme impact | Vanity reporting only |
| Revenue vs. non-member average | Medium: better than total revenue but still prone to selection bias | Early-stage programmes with no holdout group |
| Matched control group | High: removes pre-existing spend differences | Programmes with sufficient member volume |
| Randomised holdout group | Highest: true incrementality measurement | Established programmes with 500+ active members |
Common mistakes when assessing loyalty programme success
Common loyalty measurement errors include using total member revenue as incremental profit, applying average breakage rates, measuring ROI too early, and focusing on engagement metrics over profit. Each of these mistakes produces inflated ROI figures that erode stakeholder confidence when the real numbers eventually surface.
The most damaging mistake for small businesses is measuring ROI too early. Incremental CLV effects take time to materialise. A member who joins in January may not reach their first redemption until March. Measuring ROI at six weeks and declaring the programme a failure, or a success, before the data has matured leads to decisions based on noise rather than signal.
Avoid these specific pitfalls when assessing loyalty programmes:
- Counting enrolments as proof of engagement without tracking activation
- Using a single average breakage rate across all member segments
- Comparing member spend to non-member spend without controlling for pre-existing differences
- Reporting engagement metrics such as app opens or email clicks as success indicators without linking them to profit
- Ignoring the cost of staff time and technology in your total programme cost calculation
Pro Tip: Revisit your breakage and redemption assumptions every quarter. If your top 10% of members are redeeming at twice the rate you modelled, your cost forecast is wrong and your ROI figure is overstated. Catching this early lets you adjust reward thresholds before the liability grows.
Key takeaways
Loyalty programme success is measured through incremental profit, milestone-based KPIs, and a counterfactual baseline, not through total member revenue or engagement metrics alone.
| Point | Details |
|---|---|
| Use incremental profit, not total revenue | Calculate ROI as incremental net profit divided by total programme costs, validated against a control group. |
| Forecast redemption costs at member level | Segment members by redemption behaviour to avoid underestimating your largest variable cost. |
| Track the four journey milestones | Monitor acquisition, activation, return, and redemption rates within defined time windows to catch problems early. |
| Run a 90-day pilot first | Define success criteria before launch and use a matched control group to measure true incrementality. |
| Revisit assumptions quarterly | Update breakage rates, CLV estimates, and cost models every 90 days as real member data accumulates. |
Why most loyalty measurement advice misses the point
I have worked with dozens of small business owners who were convinced their loyalty programme was performing well because their member spend was higher than their non-member spend. When we dug into the data, the picture was almost always more complicated. Their best customers had self-selected into the programme. The spend gap existed before the programme launched. The programme had not created the difference. It had simply labelled it.
The mindset shift that makes the biggest practical difference is moving from “how much are members spending?” to “how much more are they spending because of the programme?” That question requires a baseline, and most small businesses do not have one. Setting up even a rough control group before you launch, or in the first month of operation, gives you data that is worth far more than any engagement dashboard.
Redemption cost surprises are the second most common problem I encounter. A business owner runs a stamp card for six months, sees strong activation numbers, and feels confident. Then a cohort of members all reach their tenth stamp in the same month and the reward fulfilment cost hits the accounts in a single week. This is not bad luck. It is a forecasting failure. Modelling redemption timing by cohort, not just by annual average, prevents this entirely.
The businesses that get the most from their loyalty programmes are not the ones with the most sophisticated technology. They are the ones that define what success looks like before they start, measure it honestly, and adjust quickly when the data tells them something unexpected. That discipline is available to any SMB owner willing to spend an afternoon building a proper measurement model.
— Michal
How Bonusqr supports accurate loyalty programme measurement
Bonusqr is built for small and medium-sized businesses that need a loyalty programme they can actually measure. The platform’s stamp card programme tracks member behaviour across every journey stage, from first enrolment through to reward redemption, giving you the data you need to calculate activation rates, return rates, and redemption frequency without manual record-keeping. The mobile and web application provides real-time analytics so you can monitor KPI changes as they happen and respond before small dips become larger problems. Bonusqr’s member segmentation tools let you group customers by engagement level, which is the foundation of accurate redemption cost forecasting and defensible ROI reporting. If you are ready to move beyond guesswork and start measuring loyalty programme effectiveness properly, Bonusqr gives you the tools to do it from day one.
FAQ
What does measuring loyalty programme success actually mean?
Measuring loyalty programme success means calculating the incremental profit your programme generates above what enrolled customers would have spent without it, net of all programme costs. Total member revenue is not a reliable success indicator because it includes spending that would have occurred regardless of the programme.
Which KPIs should a small business track first?
Start with 30-day activation rate, 90-day return rate, and first redemption rate. These three metrics cover the most critical customer journey milestones and give you early signals about whether your programme is generating incremental behaviour or simply labelling existing habits.
How do you calculate ROI for a loyalty programme?
Loyalty programme ROI is calculated as incremental net profit divided by total programme costs. Incremental net profit is the difference in purchasing behaviour between your programme members and a comparable control group of non-members, measured over the same period and net of all reward fulfilment and operating costs.
How long should you wait before measuring loyalty programme ROI?
A 90-day pilot provides enough data to assess early lift, but full ROI measurement should align with your customers’ natural buying cycle. Measuring too early, before incremental CLV effects have had time to develop, produces misleading results that can lead to poor decisions about programme continuation or investment.
Why is redemption cost forecasting important for loyalty ROI?
Redemption is typically the largest variable cost in a loyalty programme, and applying a single average breakage rate across all members distorts your cost projections. Forecasting at the individual member level, segmented by engagement behaviour, produces a far more accurate picture of your true programme liability and protects your ROI model from unexpected cost spikes.