The correct formula is (incremental contribution margin minus attributable programme costs) divided by attributable programme costs, applied only to the sales your programme actually caused, not total member revenue. Well-optimised programmes typically land in a 300–500% ROI range, with total programme costs sitting at 1 to 3% of revenue. Getting there means fixing three things: the data you collect, the method you use to prove causation, and the worksheet you use to model it.
TL;DR:
- Relying on gross member revenue instead of incremental margin greatly inflates ROI claims, as only the actual additional profit caused by the programme counts.
- Proper attribution methods like difference-in-difference and randomized holdouts are essential to prove causation, avoiding overestimations from existing customer loyalty.
- Costs must include rewards, platform fees, staffing, marketing, and implementation over multiple years, with transparent allocation of shared expenses.
- Activation and redemption rates are more indicative of programme success than enrolment figures, and continuous testing helps improve ROI.
- A measurement-first platform with real-time data and flexible reward types simplifies accurate ROI calculation and supports long-term, margin-focused loyalty strategies.
How to calculate loyalty programme ROI step by step
The single biggest mistake marketing managers make is putting gross member revenue into the ROI formula instead of incremental contribution margin. If a member spends £500 a year and would have spent £400 anyway without the programme, only the £100 difference (adjusted for margin) counts. Confuse the two, and you’ll present a number to finance that collapses under the first hard question.
Here’s the sequence that produces a defensible figure:
- Establish a baseline. Pick either a non-member comparison group or a pre-enrolment window for the same customers. Both approaches have trade-offs: non-members may differ demographically from members (selection bias), while pre/post comparisons can be distorted by seasonality. Ideally, you run both and check they roughly agree.
- Calculate per-member incremental revenue. Subtract baseline average spend from post-enrolment average spend, for a matched or comparable period (same season, same length, same promotional calendar as far as possible).
- Convert to contribution margin. Multiply that incremental revenue figure by your product or category margin, net of variable costs like fulfilment and payment processing. This is where a lot of ROI claims quietly overstate impact by using revenue instead of margin.
- Scale to the full member population. Multiply per-member incremental margin by the number of active members in the measurement window, not total enrolled members. Enrolled-but-dormant accounts contribute nothing and will dilute your baseline if included.
- Align time windows precisely. Programme costs and incremental margin must cover the identical period. Comparing a full year of costs against a six-month uplift figure is a common and easily avoided error.
That’s £18 × 0.35 = £6.30 incremental margin per member, ×10,000 members = £63,000 in incremental contribution margin for the quarter. That figure feeds directly into the ROI formula once you’ve totalled your costs for the same three months.
This is also where loyalty programmes drive profitable sales growth rather than just topline growth, because the formula forces you to separate genuine margin gains from customers who were always going to buy.
What data and KPIs do you need to track?
A finance-ready ROI calculation depends on a specific, unglamorous set of inputs. Skip any of these and your incremental margin figure becomes an estimate dressed up as a fact.
Core performance KPIs:
- Customer lifetime value (CLV), tracked separately for members and a comparable non-member cohort
- Purchase frequency, measured per member per defined period (weekly, monthly, or quarterly depending on your category)
- Average order value (AOV), split by member status to isolate basket-size effects from frequency effects
- Retention rate, calculated over rolling 90 or 180-day windows rather than a single annual snapshot
Engagement and programme health metrics:
- Activation rate: the share of enrolled members who complete a first qualifying action within 30 days
- Redemption rate: rewards claimed as a percentage of rewards earned
- Active member share: members who transacted in the last measurement window, versus total enrolled
- Net Promoter Score (NPS), tracked at enrolment and again after several redemption cycles
Enrolment volume on its own tells you almost nothing about ROI. Industry commentary on the “engagement paradox” found that while 41.9% of members report feeling more loyal. Only 35% actually report spending more, a gap that shows why activation and redemption data matter more than sign-up counts.
Before any of these numbers reach a spreadsheet, run basic hygiene checks: a unified customer ID across POS, e-commerce, and app data; deduplication of accounts created under different emails or phone numbers; consistent measurement windows across every metric you compare; and a clear rule for how returns and refunds affect both the numerator and the baseline.
Pro Tip: Segment your incremental revenue calculation by acquisition channel and tenure cohort before you average it. A programme that looks flat overall can be masking a high-performing six-month cohort dragged down by a poorly onboarded older one.
Which attribution methods actually prove causation?
Enrolment correlating with higher spend proves nothing on its own. People who join loyalty programmes are often already your best customers, which means raw before-and-after comparisons routinely overstate impact. EY’s guidance on demonstrating loyalty ROI argues that longitudinal and experimental methods carry far more weight with finance teams than simple cross-sectional comparisons, and notes that 41% of loyalty leaders still find quantifying impact genuinely difficult.
Four methods worth building into your measurement plan:
- Difference-in-difference (DiD). Compare the change in spend for members against the change for a matched control group over the same period. This cancels out seasonality and macro trends that would otherwise inflate your incremental figure.
- Matched-cohort pre/post analysis. Pair each member with a statistically similar non-member (same tenure, geography, and prior spend band), then compare trajectories after enrolment.
- Randomised holdouts. Withhold programme access or a specific offer from a randomly selected slice of eligible customers. This is the cleanest causal design available and the one finance teams find hardest to argue with.
- Small-scale uplift or “mission” tests. Rather than holding out an entire programme, test individual offers or campaigns against a matched control. One grocery test using this approach produced an incremental ROI of roughly 3.25x over six weeks, a scale most retailers can realistically run.
Multi-touch attribution and uplift modelling become useful once you’re running several concurrent campaigns and need to separate loyalty-driven lift from a simultaneous paid media push or seasonal promotion. Whichever method you choose, document every concurrent marketing activity during the test window. A loyalty uplift measured during a site-wide sale will be contaminated by that sale, and any finance reviewer worth their salary will ask about it.
What costs belong in your total programme cost line?
Under-counting costs is the second most common way ROI claims fall apart, right behind using gross revenue instead of margin. A complete cost model needs to capture every line that touches the programme, not just the obvious ones like reward redemptions.
- Reward liability and fulfilment. Include the cost of redeemed rewards, plus a breakage assumption for points or stamps that will never be redeemed (breakage reduces your liability but should be modelled conservatively, not assumed away entirely).
- Platform and technology costs. Software subscription fees, integration work, and any data infrastructure needed to unify customer records across channels.
- Marketing and campaign production. Design and production costs for member communications, plus the incremental customer acquisition cost attributable specifically to loyalty-driven sign-up campaigns.
- Staffing, fraud prevention and compliance. Time spent by marketing, customer service, and analytics staff managing the programme, plus any fraud monitoring and legal or data-protection compliance work.
- One-off implementation costs. Amortise launch costs, brand design, and initial system build over a realistic multi-year period rather than charging them entirely against year one.
For allocation, apportion shared costs (a CRM licence used for loyalty and other campaigns, for instance) by the proportion of usage genuinely attributable to the loyalty programme, and state that allocation method explicitly wherever you report the number. An ROI figure with unstated allocation assumptions invites, and deserves, scepticism.
Worked example: turning uplift into an ROI figure
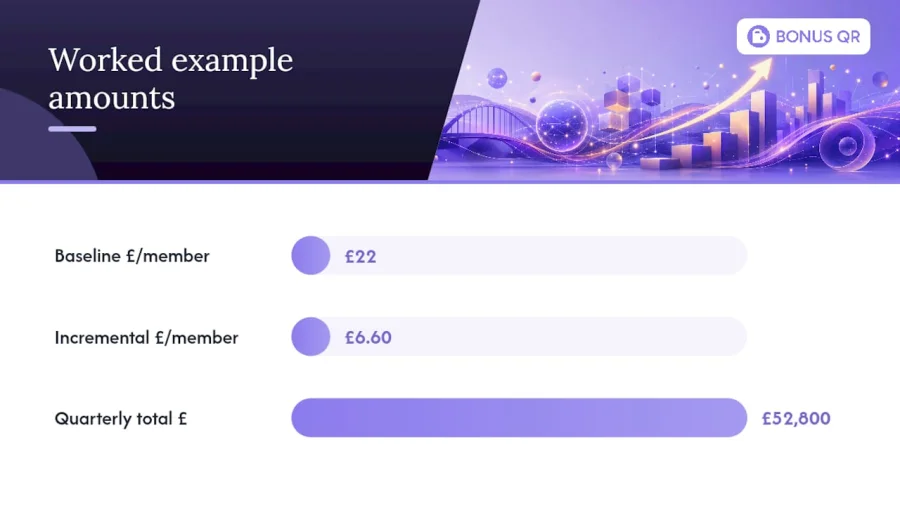
Take a mid-sized retailer running a points programme with 8,000 active members.
That’s £22 × 0.30 = £6.60 incremental margin per member, ×8,000 = £52,800 incremental contribution margin for the quarter. That sits just under the 300–500% benchmark range for well-optimised programmes, which tells you where to look for improvement before you present the number.
A working ROI worksheet needs these inputs and outputs, whether you build it in a spreadsheet or pull it from your platform’s analytics dashboard:
Sensitivity analysis is what separates a defensible number from a lucky one. Practitioner guidance recommends running scenario bands rather than a single point estimate:
- Vary active participation between 80% and 120% of your baseline assumption
- Vary redemption rate up and down by 10 percentage points to test breakage sensitivity
- Vary contribution margin by ±5 percentage points to reflect product mix shifts
If your ROI stays comfortably above zero across every downside scenario, you have a genuinely resilient number. If it turns negative under a modest participation dip, that’s a finding worth taking seriously before you present anything upstairs.
How do you diagnose and fix a weak loyalty programme ROI?
A low ROI figure is a symptom, not a diagnosis. Before touching the reward structure, run through a short checklist: what’s your activation rate among new enrolees, what’s your redemption rate against earned rewards, which customer segments are dragging the average down, and where is margin leaking through unaccounted discount stacking or fulfilment costs?
Activation is usually the first lever worth pulling, because engagement, not enrolment, is what converts sign-ups into spend.
Once activation is addressed, work through these levers roughly in order of typical impact:
- Personalise reward thresholds to individual purchase history rather than one flat target for every member.
- Introduce tiering so your highest-value customers see a visibly better return, which tends to lift both frequency and referral behaviour.
- Shift from a static catalogue to mission-based offers tied to specific behaviours you want to encourage (a second category purchase, a return visit within 30 days).
- Review reward economics quarterly, not annually, so margin-eroding SKUs or over-generous cashback tiers get caught early.
Size each experiment before you run it: estimate the expected uplift, multiply by affected member count and margin, and only commit budget to tests where the modelled return clears your existing baseline ROI by a comfortable margin.
Pro Tip: Run your highest-conviction optimisation idea as a small mission test with a matched control before rolling it out programme-wide. A four-week test costs a fraction of a full relaunch and tells you honestly whether the idea works.
How do you present loyalty ROI to finance and executives?
Finance teams are sceptical of loyalty ROI for good reason. Most figures presented to them skip causal proof entirely. A three-part evidence pack addresses that scepticism directly and gives executives something they can interrogate rather than simply accept on faith.
- Causal proof first. Lead with your control-group or difference-in-difference design, not the headline ROI number. Showing the method builds more credibility than showing a bigger figure.
- Economics second. Translate uplift into contribution margin using the same cost and margin assumptions your finance team already uses elsewhere, so the number reconciles against figures they recognise.
- The compounding story third. Show how retention gains compound CLV over multiple years, not just the measurement quarter, since loyalty’s real value is rarely visible in a single period.
For visuals, one slide should show the control-versus-treatment spend trajectory over time; one should show the ROI calculation broken into its component costs; and one should show the sensitivity range from your scenario testing, not a single confident number.
Why BonusQR is built for measurement-first loyalty programmes
Everything above assumes you can actually get clean data out of your loyalty platform, which is where a lot of well-designed measurement plans quietly stall. Some loyalty platforms offer real-time analytics that track activation, redemption, and active member share as standard, providing the raw inputs the ROI formula needs without a separate data-wrangling project.
Some loyalty platforms include features that support measurement, such as modular programme design to run various reward types in parallel for testing, rapid setup without POS integration requirements to enable quick control-group tests, and automated campaign and push notification tools to support small-scale tests producing clear uplift signals.
You can review the platform’s analytics and campaign features to see how the data capture maps onto the metrics this article has covered.
What incrementality gets right that vanity metrics miss
Most loyalty programmes get measured on the wrong axis entirely. Enrolment counts and points issued feel like progress, but neither tells you whether the business is better off. The uncomfortable truth is that a programme can grow its member base every quarter while its actual incremental ROI quietly declines, because activation and redemption rates are drifting downward beneath the headline growth number.
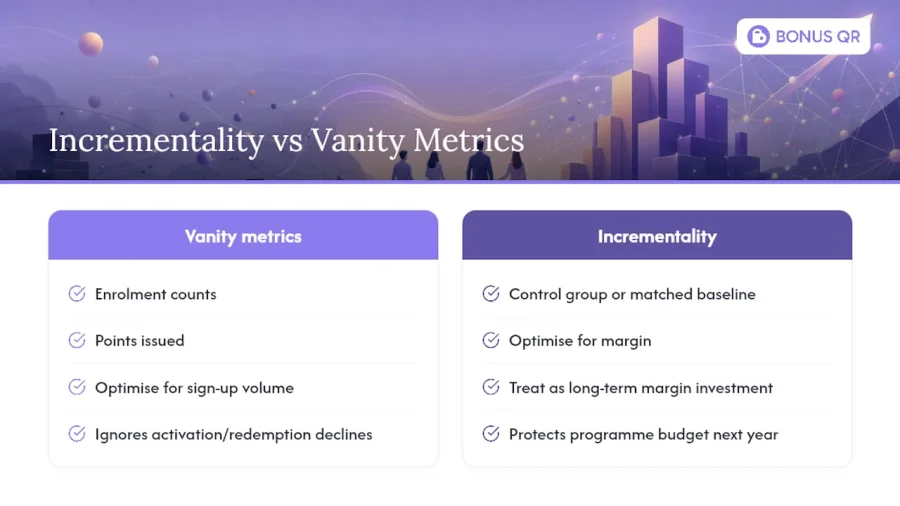
The discipline of insisting on a control group or a matched baseline, even an imperfect one, forces a different kind of decision-making. It stops teams optimising for sign-up volume and starts them optimising for margin. That trade-off is uncomfortable in the short term, because a smaller, better-activated member base often looks worse on a slide about growth. Over a two or three-year horizon, it’s the only version of the programme that survives a serious finance review.
Treat loyalty as a long-term margin investment, not a marketing campaign with a quarterly deadline, and the measurement question stops being a compliance exercise and becomes the thing that actually protects the programme’s budget next year.
— Michal
Get a loyalty programme built to prove its own ROI
Running the calculations above is far easier when your platform is already capturing the right data by default. BonusQR gives you real-time analytics on activation, redemption, and active member share from day one, alongside modular reward types (points, stamp cards, cashback, and fixed discounts) that let you test reward economics without rebuilding your programme from scratch each time. There’s no POS integration to negotiate and no lengthy implementation project standing between you and your first control-group test.
Whether you need a straightforward mobile and web programme or a fully branded white-label app, setup is designed to be fast enough that you can launch a test this quarter rather than next year. Explore the fixed discount programme options or head to the main platform page to start building a programme that gives you a genuine answer, not just a hopeful one, the next time finance asks about ROI.
Sources
- What is ROI? — IE Business School
- The Loyalty Newswire — The Wise Marketer
- ROI in a loyalty program — LoyaltyPoint
FAQ
What is the average ROI for loyalty programmes?
Well-optimised programmes typically report a 300 to 500% ROI, though this varies by sector and depends heavily on how rigorously incremental margin is measured against total attributable costs.
What is the return on investment of a loyalty programme?
It’s calculated as incremental contribution margin minus attributable programme costs, divided by those same costs, using only the sales the programme can be shown to have caused rather than total member spend.
How profitable are loyalty programmes?
Profitability depends on activation and redemption, not enrolment size. Programmes with high sign-ups but low activation often underperform smaller, better-engaged programmes, since only around 35% of members typically report spending more despite far higher numbers reporting increased loyalty.
What is the average redemption rate for loyalty programmes?
Redemption rates vary significantly by industry and reward structure, so there’s no single reliable average; what matters more for ROI purposes is tracking your own redemption rate consistently against your breakage assumptions over time.
How do I know if my loyalty programme data is reliable enough to calculate ROI?
Check for a unified customer ID across every sales channel, deduplicated accounts, and consistent measurement windows across all your KPIs before trusting any ROI figure calculated from that data.


