
Track four numbers, not forty: one financial metric (customer lifetime value or revenue per member), one behavioural metric (retention rate or repeat purchase rate), one attitudinal metric (NPS or CSAT), and a leading indicator such as first-redemption conversion or active member rate. That combination tells you whether loyalty is improving, whether members feel it, and whether trouble is coming before the revenue numbers confirm it. Everything below explains the formulas, how to pick your own set, and how to prove the programme’s return to finance.
TL;DR:
- Customer lifetime value and retention rate should be monitored quarterly, as they provide long-term revenue insights and early signs of trouble.
- Redemptions within the first 60 days and active member rates below 20 percent are strong indicators of engagement issues needing immediate attention.
- Combining behavioral metrics like repeat purchase rate with attitudinal measures such as NPS offers a fuller picture of customer loyalty and advocacy.
- Use control groups, pre/post analysis, or CLV differentials to accurately measure loyalty program impact instead of relying on raw revenue comparisons.
- Segmentation by purchase behavior and demographics enhances insight accuracy, especially when rewards and responses vary significantly across customer groups.
Core loyalty metrics: definitions, formulas and when to use each
Every loyalty dashboard rests on a small set of calculations. Get these right and the rest of your reporting builds itself.
Customer Lifetime Value (CLV) estimates the total revenue a customer generates over their relationship with you. The standard formula is CLV = average order value × purchase frequency × average customer lifespan. If a customer spends £40 per order, buys multiple times a year, and stays loyal for several years, their CLV reflects the total revenue over that period. It’s a lagging metric, best reviewed quarterly, and it’s the number finance teams trust most because it ties directly to revenue.
Retention rate measures the percentage of customers you keep over a given period. The formula for retention rate is (customers at end of period − new customers acquired) ÷ customers at start of period × 100. A café with 500 members at the start of the quarter, 60 new sign-ups, and 480 members at the end has a high retention rate. Review it monthly.
Churn rate is the mirror image: the percentage of customers lost. Churn = 100 − retention rate. If retention sits at 84%, churn is 16%. Watch this one closely, because a slow creep in churn often signals a pricing or service problem before complaints do.
Repeat purchase rate (RPR) shows the share of customers who buy more than once. RPR = (number of returning customers ÷ total customers) × 100. A gym with 300 active members, many of whom rebooked a class or renewed within the period, has a strong repeat purchase rate. It’s behavioural, monthly, and one of the most reliable signals of profit growth in retail and dropshipping models, where a single repeat customer can be worth far more than the cost of acquiring a new one.
Average Order Value (AOV) is total revenue ÷ number of orders. It feeds directly into CLV, so track it alongside retention rather than in isolation.
Net Promoter Score (NPS) asks one question, “How likely are you to recommend us?”, on a 0 to 10 scale. NPS = % promoters (9 to 10) − % detractors (0 to 6). A positive NPS score indicates more promoters than detractors. Run this quarterly to avoid survey fatigue.
Customer Satisfaction (CSAT) measures satisfaction with a specific interaction, usually on a 1 to 5 scale, expressed as the percentage who scored 4 or above. It’s tactical and immediate, best measured right after a purchase or support ticket, not quarterly.
Customer Effort Score (CES) captures how easy it was to complete an action, like redeeming a reward. Lower effort correlates strongly with repeat behaviour, and it’s worth tracking whenever you redesign your redemption flow.
Reward redemption rate = (rewards redeemed ÷ rewards issued) × 100. It’s a leading indicator: low redemption within the first 60 days often predicts disengagement long before churn shows up.
Active member rate = (members who transacted in the period ÷ total enrolled members) × 100. This exposes the gap between sign-ups and genuine engagement.
Referral rate = (customers who referred someone ÷ total customers) × 100, a strong proxy for advocacy that NPS alone can miss.
A concise metric set built from these eight to eleven numbers, paired with RFM segmentation to identify your highest-value cohorts, covers nearly everything a loyalty programme needs to report.
Pro Tip: Always cohort by enrolment date, not calendar month, when calculating retention or RPR for loyalty members. Mixing cohorts hides early drop-off and makes a struggling programme look healthier than it is.
Watch for three measurement traps: selection bias (members often shop more before joining, so raw member revenue overstates programme impact), double-counting redemptions across channels, and inconsistent time windows that make month-to-month comparisons meaningless.
Behavioural versus attitudinal metrics and how to combine them
Behavioural metrics record what customers actually do: purchases, redemptions, visit frequency, RFM (recency, frequency, monetary) scores. Attitudinal metrics record what customers say they feel: NPS, CSAT, CES. Neither tells the full story alone. A customer can keep buying out of habit or lack of alternatives while quietly resenting your brand, and a customer can love you enthusiastically while buying rarely because of budget, not loyalty.
A simple 2x2 grid clarifies the mismatch:
- High sentiment, high behaviour: your healthiest segment. Protect it with recognition, not more discounts.
- High sentiment, low behaviour: advocates who aren’t spending. Investigate friction, price, or product fit.
- Low sentiment, high behaviour: at-risk revenue. These customers will leave the moment a competitor removes the reason they’re stuck with you.
- Low sentiment, low behaviour: disengaged. Rarely worth heavy investment; focus resources elsewhere.
Pairing rules that work in practice: high-repeat eCommerce brands should lean on RPR and redemption rate with quarterly NPS as a check. Low-repeat retail (furniture, appliances) should weight CSAT and referral rate higher, since purchase frequency is naturally low. B2B and SaaS businesses should prioritise CES and active-usage metrics over transaction counts, since the “purchase” is often a renewal, not a repeat visit.
How to choose the 3 to 4 metrics your dashboard needs
- Clarify the objective first. Are you trying to prove ROI to finance, reduce churn, or grow average spend? The objective determines which metric leads.
- Pick one financial metric. CLV for most businesses; revenue per member if your sales cycle is too short for lifetime modelling.
- Pick one behavioural metric. Retention rate for subscriptions and services; repeat purchase rate for consumables and retail.
- Pick one attitudinal metric. NPS for board-level reporting; CSAT if you need faster, transaction-level feedback.
- Add one leading indicator. First-redemption conversion or active member rate, so you catch problems before quarterly numbers confirm them.
Subscriptions should weight churn and CLV heavily; consumables should prioritise RPR and redemption rate; service businesses (salons, clinics, gyms) often get more signal from active member rate than from CLV alone, since visit frequency matters more than order size.
Before finalising your set, confirm three things with your data and finance teams: can your point-of-sale or booking system tag transactions to individual loyalty members, does your survey tool track NPS or CSAT by customer segment rather than in aggregate, and does finance agree on how “incremental” revenue will be defined and attributed.
Measuring loyalty programme ROI: experiments and incremental lift
Forty-one percent of corporate loyalty leaders say they struggle to quantify their programme’s overall impact, and the usual culprit is comparing total member revenue against non-member revenue. That comparison is misleading because members typically shopped more before they ever joined. The fix is measuring incremental lift, not raw revenue.
The only defensible way to prove a loyalty programme works is to show what would have happened without it. That means a control group, a pre-enrolment baseline, or both. Anything less is a correlation dressed up as a result.
The three methods worth setting up:
- A/B or test/control: hold back a randomly selected group from enrolment or from a specific reward, then compare spend over the same period.
- Pre/post with difference-in-difference: compare each member’s behaviour before and after joining against a matched control group’s change over the same window, isolating the programme’s true effect from seasonal or market shifts.
- CLV differential and point liability: track CLV for members against a matched non-member cohort, and separately monitor outstanding point liability as a balance-sheet item finance will ask about.
Talon, but that figure only means something once it’s tested against a control group. Before you report a number to finance, confirm you’ve defined your cohorts, captured pre-enrolment behaviour for comparison, and either held back a control group or staged your rollout in phases to create one naturally.
Dashboard design, cadence and sample benchmarks
A working loyalty dashboard doesn’t need forty widgets. Six to eight, refreshed on the right schedule, will outperform a bloated report nobody reads.
- Trend chart: retention rate and CLV over rolling 12 months.
- Cohort table: RPR and redemption rate by enrolment month.
- Cohort waterfall: showing how each monthly cohort’s active rate decays or holds over time.
- Funnel view: sign-up → first redemption → second redemption, to expose drop-off points.
- Sentiment panel: NPS and CSAT trend, updated quarterly.
Cadence matters as much as the metrics themselves. Refresh behavioural KPIs (retention, RPR, redemption rate) monthly. Run sentiment surveys like NPS and CSAT quarterly, since more frequent surveying tends to fatigue customers without adding useful signal. Review full cohort performance quarterly, and run ad-hoc experiment analysis after any major campaign or reward change.
As illustrative starting points rather than fixed rules: many programmes treat first-redemption conversion above 30% within 60 days as healthy, and an active member rate below 20% usually signals an onboarding or communication gap worth investigating. Set your own baseline in month one and judge every future reading against it, not against another company’s number.
Industry benchmarks and standards for loyalty metrics
Loyalty benchmarks vary sharply by sector, so treat any single-figure “industry average” with caution. Subscription and services businesses tend to report higher retention rates, often north of 80%, because switching costs are built into the model. Retail and consumables brands typically run lower, since customers naturally shop around, so redemption rate and RPR carry more diagnostic weight than raw retention.
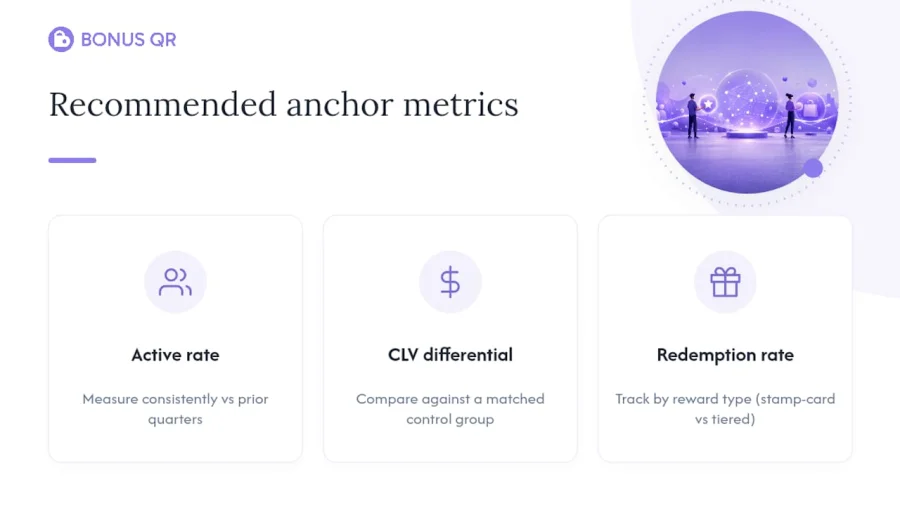
Redemption rate benchmarks also swing by reward structure. Simple stamp-card style programmes, where the reward is visible and close, usually see stronger redemption than tiered cashback schemes with distant thresholds. That’s not a flaw in tiered rewards; it’s a reason to track redemption separately by reward type rather than blending them into one figure.
Rather than chasing a published industry average, the more useful standard is internal: your own baseline, measured consistently, tracked against your own prior quarters. A long list of loyalty KPI templates exists, but many of the entries on those lists are administrative counts, like total enrolment or aggregate email opens, that measure activity, not impact. Total enrolment tells you how many people signed up. It says nothing about whether the programme is working. Anchor your benchmarking around active member rate, CLV differential against a matched control, and redemption rate, and treat the rest as optional colour.
Using segmentation to tailor loyalty metrics analysis
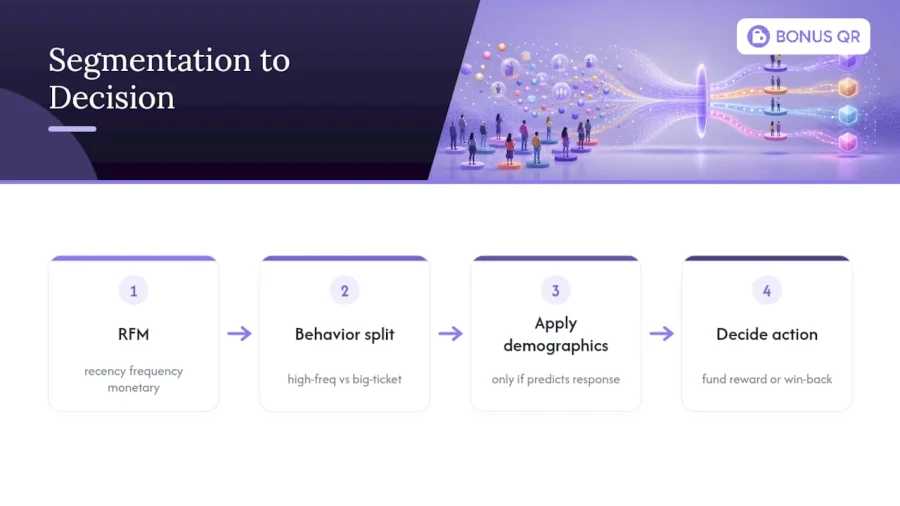
Aggregate metrics flatten your best and worst customers into one misleading average. Segmentation fixes that, and RFM (recency, frequency, monetary) analysis remains the most practical starting model because it needs nothing beyond transaction data you already hold.
Segment by purchase behaviour first: high-frequency, high-spend customers should be tracked separately from occasional big-ticket buyers, since a single luxury purchase can distort AOV for an entire cohort if it isn’t isolated. A boutique hotel, for instance, might segment business travellers who book monthly against leisure guests who book once a year, since applying the same retention target to both groups produces meaningless numbers for either.
Demographic segmentation matters most when your reward structure varies by customer type, such as age-based promotions or location-specific offers. If a gas station chain runs a fuel discount for commuters and a separate snack-bundle reward for occasional visitors, blending both groups into one redemption-rate figure hides which reward is actually working.
The practical rule: segment first by behaviour (RFM tier), then overlay demographics only where you have a genuine reason to expect different responses. Segmenting for its own sake multiplies your dashboard without adding insight, so limit it to splits that will change a real decision, like which reward to fund next quarter or which cohort needs a win-back campaign.
Case studies: loyalty metrics in different business contexts
The average masked a real operational problem: staff at the lagging stores weren’t prompting customers to scan their card. Fixing that training gap, not the reward structure, closed the gap within a quarter.
A subscription-based wellness brand used a pre/post difference-in-difference analysis to test whether its tiered cashback programme drove genuine incremental spend.
A service-based gym chain leaned on active member rate instead of CLV as its primary metric, because membership renewals made lifetime value nearly identical across most customers. Tracking which members hadn’t attended in 30 days let staff intervene with a personal check-in before cancellation, cutting churn among that flagged group by a meaningful margin over two quarters. Choosing the metric that actually matched the business model, rather than defaulting to the most commonly cited one, made the difference.
Practitioner perspective: priorities and traps in loyalty measurement
Most businesses launching a programme obsess over enrolment numbers first. It’s the easiest metric to grow and the least useful one to report. A cohort test comparing enrolled customers against a held-back control group, even a small one, will tell you more in six weeks than a year of watching sign-ups climb.
The trap worth naming directly: enrolment is a vanity metric dressed as progress. Active member rate and redemption rate expose what enrolment hides. If you’re setting up measurement for the first time, start with a simple redemption funnel before building anything elaborate, and lean on BonusQR’s feature set to get real data flowing quickly rather than delaying for a perfect dashboard.
— Michal
Choosing the right platform matters as much as choosing the right metrics, because you can’t measure what your system can’t capture. BonusQR gives you stamp cards, tiered cashback, and coupon management tools built to log every redemption and active member interaction automatically, so the leading indicators covered above, first-redemption conversion, active member rate, and repeat purchase rate, populate your dashboard without manual spreadsheet work. Whether you run a service business, a hotel, or a retail storefront, setting up a BonusQR account gives you the transaction-level data this article’s formulas depend on, from day one.


