Sarah, who runs a small café in Bristol, has a familiar problem. A stack of paper stamp cards sits beside the till, customers enjoy collecting them, and staff hand out replacements every week. Yet when Sarah asks whether the scheme has paid back, the till can't show how many extra visits or pounds came from loyalty activity.
That gap affects cafés, salons, gyms, restaurants, and independent shops across the UK. Owners often count sign-ups, because that's the easiest number to see, while the figures that matter, repeat visits, average spend, reward cost, and incremental revenue, remain hidden.
A practical loyalty programme doesn't need enterprise software or a complicated finance model. It needs five useful metrics, a defined payback window, and a weekly measurement habit. The result is a number that tells an owner whether loyalty is creating profitable behaviour or merely creating administrative work.
Why Most Small Business Owners Cannot Answer the Loyalty ROI Question
Small operators rarely launch loyalty schemes with bad intentions. A competitor introduces a digital card, regular customers ask whether the business has one, and a simple stamp offer seems like a sensible response. The trouble starts when enthusiasm at the counter gets mistaken for commercial performance.
A paper card records a reward journey, not a customer journey. It may show that someone collected stamps, but it usually won't show whether that person visited more often, spent more per visit, or would have bought the same items without the incentive.
The sign-up trap
A café can have a growing pile of completed cards and still have no defensible loyalty program ROI. Membership volume is an activity measure. It becomes commercially useful only when the business can connect a member to transactions and compare that behaviour with a realistic baseline.
That's difficult when the programme sits apart from the point of sale. Staff might tick a card, but nobody records the customer's transaction value, visit timing, or reward status in a way the owner can analyse later. The owner is left relying on comments such as “customers seem to like it”, which may be true but doesn't answer the payback question.
Practical rule: If the scheme can't distinguish a member's repeat spend from ordinary sales, it isn't measuring loyalty ROI. It's measuring participation.
A weekly answer is possible
The fix isn't to build a corporate loyalty department. A small business needs a repeatable loop:
- Record a baseline: Establish revenue, visits, average order value, and active customers before changing the offer.
- Identify members: Connect each loyalty action to a customer profile or usable identifier.
- Compare behaviour: Review members against non-members or their own pre-enrolment pattern.
- Subtract real costs: Include rewards, platform fees, promotion, and staff time.
- Review weekly: Use the result to adjust the offer before costs drift.
That approach changes loyalty from a paper-based guessing game into a manageable operating measure. The central question is no longer whether customers like the programme. It's whether the programme creates enough incremental value to justify its cost.
What Loyalty Program ROI Really Means
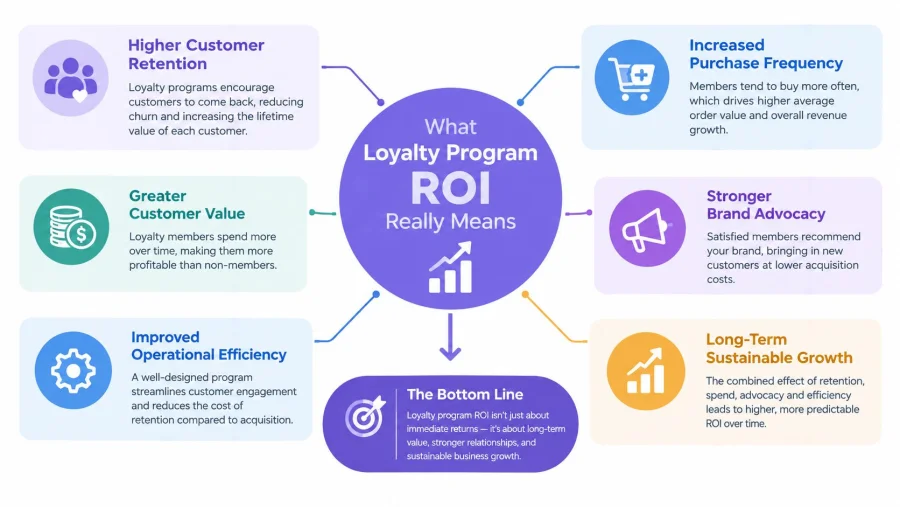
A loyalty programme can look busy and still lose money. Loyalty programme ROI measures the financial return from loyalty activity after its costs are removed. Start with incremental revenue, the sales that would not reasonably have happened without the programme.
Use this formula:
Loyalty ROI = ((Incremental Revenue from Loyalty Members − Loyalty Programme Costs) ÷ Loyalty Programme Costs) × 100
A café generating £14,000 in loyalty-attributable revenue with £2,000 in programme costs would calculate:
((£14,000 − £2,000) ÷ £2,000) × 100 = 600% ROI
The result only works if the £14,000 is incremental. Total member spending includes purchases customers may have made anyway, so compare it with a pre-enrolment baseline or a similar non-member group.
Revenue beats enrolment
A loyalty card with 5,000 members shows that the offer attracted attention. It does not show a return. Members must spend more, visit more often, or generate a higher average order value than the comparison group for the programme to create economic value.
Build the calculation around five inputs:
- Member revenue: What members spend during the review period.
- Baseline revenue: What similar customers spent before joining, or what comparable non-members spend.
- Incremental revenue: The difference reasonably linked to the programme.
- Programme cost: Rewards, fees, marketing, staff administration, and related expenses.
- Net return: Incremental revenue minus those costs, adjusted for margin where possible.
Payback needs a time window
A ROI figure without a time period can flatter a weak programme. A launch may create a rush of sign-ups and redemptions, then visits can return to normal. Small operators should assess a fuller result over 6 to 12 months, while checking weekly and monthly behaviour for early warning signs.
UK operators should plan for measured payback, not instant results. Collinson's 2025 research reports an average brand payback period of 2.7 years and says 59% of retail brands reach ROI within 3 years (Collinson's Loyalty Landscape research).
That timeline does not justify waiting years to manage the programme. A café should look for early evidence that visits, spend, or retention are improving, then test whether the added contribution covers the ongoing cost. A low-cost QR platform makes that review practical by recording scans and redemptions in a weekly loop instead of leaving staff to interpret paper cards. Owners improving the wider retention journey can also review this guide to boost client loyalty with onboarding.
The Five Metrics That Actually Drive Loyalty ROI
A loyalty programme earns its keep through measurable customer behaviour. For a small UK operator, five metrics show whether the scheme is increasing profitable visits, protecting repeat business, or creating costs that look acceptable on paper but weaken payback.
Customer lifetime value
Customer lifetime value, or LTV, estimates the value of a customer across the relationship:
LTV = Average spend per visit × Visits per year × Average customer lifespan in years
A customer spending £5 per visit and returning regularly can be worth far more than a new member who joins once and disappears. Use the business's own transaction history rather than generic assumptions. LTV helps an owner set a reward that protects profitable repeat behaviour without giving away more margin than the customer is worth.
Retention rate
Retention rate compares active members at the end of a review period with active members at its start:
Retention rate = Active members at review point ÷ Active members at starting point × 100
Track cohorts consistently. A scheme may show strong sign-ups while existing members stop visiting. The practical test is whether retained members produce more contribution than the cost of keeping them active. Treat any improvement as a result to test, not as guaranteed profit.
Visit frequency
Compare member and non-member transactions over the same period:
Visit frequency = Member transactions ÷ Active members
A café may find that members visit more often, but the comparison needs care. Regular customers often join first, which can make the programme appear more effective than it is. Review behaviour before and after enrolment, or compare members with a similar non-member group. Look for a consistent change in visit pattern, not one busy week caused by a launch offer.
Average order value
AOV = Total revenue ÷ Number of transactions
Check whether members add a pastry, upgrade a drink, or purchase another product while working towards a reward. A larger basket improves ROI only when the additional gross margin exceeds the reward cost. Separate rewarded visits from ordinary visits so a discount does not make the apparent increase look better than the actual contribution.
Customer acquisition cost
CAC = Total loyalty marketing spend ÷ New members earned
Include paid promotion, printed materials, launch activity, agency work, creative costs, and staff time where it is material. Referrals may reduce acquisition cost, but they still require tracking. Record which member generated the referral and whether the referred customer becomes active. Otherwise, the owner is guessing at the value of word-of-mouth.
| Metric | Formula | What to Measure | Sample Café Value |
|---|---|---|---|
| Customer lifetime value | Average spend × yearly visits × lifespan | Long-term customer contribution | Use the café's own transaction history |
| Retention rate | Active members at review point ÷ starting active members | Ongoing member activity | Compare the same cohorts |
| Visit frequency | Member transactions ÷ active members | Repeat visits by member | Compare with non-members |
| Average order value | Revenue ÷ transactions | Basket size and add-on behaviour | Check rewarded versus ordinary visits |
| Customer acquisition cost | Loyalty marketing spend ÷ new members | Cost of attracting members | Include all campaign costs |
Review these measures weekly, then judge payback over a longer trading period. A low-cost QR platform can record scans, visits, and redemptions without relying on staff to interpret paper cards. Owners can use loyalty program reports to keep the inputs together and identify which behaviour is producing incremental revenue. The five metrics then connect directly to ROI: added contribution minus the programme's total cost.
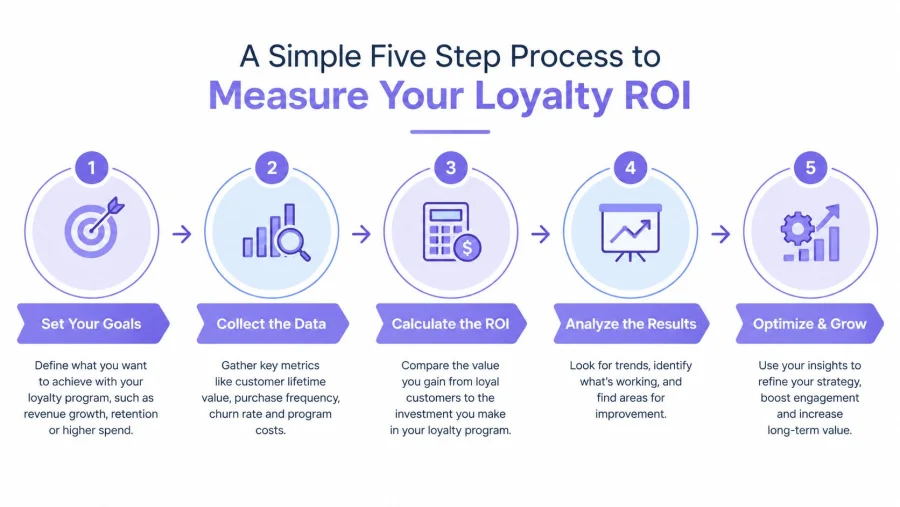
A Simple Five Step Process to Measure Your Loyalty ROI
A sole trader doesn't need a data warehouse to start. A clean spreadsheet, a consistent member identifier, and a fixed review routine can produce a useful first answer.
1. Establish the baseline
Record 90 days of revenue, visits, average order value, and active customers before changing the scheme. If historic records are incomplete, start now and label the first period clearly. The baseline must describe normal trading rather than a launch week, holiday period, or unusual promotion.
2. Define the offer cost
Write down exactly what a redemption costs the business. A free coffee has a product cost and an opportunity cost at a busy time. A percentage discount reduces revenue, while a non-price benefit may carry a smaller direct cost. Add printing, promotion, staff training, platform fees, and administration.
3. Tag members properly
Members need a consistent identifier in the point-of-sale system or QR platform. Without that tag, the owner can't isolate member spend, identify repeat visits, or distinguish a real reward redemption from a manually issued discount.
4. Run the scheme and compare behaviour
Run the offer for 60 to 90 days, then compare members with non-members using the five measures already defined. Owners should also compare each member's activity before and after joining where that history exists. The comparison should use the same dates and trading conditions.
5. Calculate incremental return
Apply the ROI formula, then subtract platform fees, reward costs, marketing, and staff time. Attribute only the revenue above the chosen baseline. Calculating repeat customer metrics can help owners organise the retention part of the review.
A simple spreadsheet needs these columns:
- Review period: Start and end dates.
- Member transactions: Visits linked to members.
- Member revenue: Revenue from those visits.
- Comparison revenue: Baseline or non-member revenue.
- Incremental revenue: The measured difference.
- Reward cost: Product or discount cost.
- Platform and staff cost: Ongoing programme expenses.
- Net return and ROI: Final calculation.
A 40-cover café spending £9 on rewards to generate £140 in incremental member spend has a simple revenue-after-reward difference of £131, before platform fees, staff time, and margin adjustments. That example is not proof of profitability until the owner adds every relevant cost.
UK Benchmarks and a Sample Calculation for a Local Coffee Shop
A local café should judge loyalty by payback, not by an impressive member count. UK evidence shows that loyalty can affect spending and recommendations, but a small operator still needs to prove whether the extra contribution covers rewards, software, and staff time.
A major UK benchmark found that 61% of loyalty members made a purchase in the previous 12 months, and those transactions generated 52% of total UK sales revenue (UK loyalty statistics benchmark). Independent consumer research reports that 47% of loyalty users spend more with a brand whose scheme they belong to, while 38% are more likely to recommend that brand (UK coupons and loyalty schemes research). These figures provide context, not a forecast for one coffee shop.
A useful local calculation
The figures requested for independent café retention, regular weekly visits, average order value uplift, and member acquisition cost payback are not verified UK benchmarks. Replace them with records from the café's POS and member database. Review the scheme weekly, then make the payback decision after a consistent test period.
The coffee-shop scenario below is useful for checking the arithmetic. Its £9,000 monthly covers, 600 members, £2.40 extra per visit, two visits per month, £180 reward cost, and £49 platform fee illustrate a model. They do not establish typical market performance.
| Metric | Value | Source |
|---|---|---|
| Monthly covers | £9,000 | Illustrative scenario supplied for modelling |
| Loyalty members | 600 | Illustrative scenario supplied for modelling |
| Extra spend per visit | £2.40 | Illustrative scenario supplied for modelling |
| Extra visits per member each month | 2 | Illustrative scenario supplied for modelling |
| Gross incremental member spend | £2,880 | 600 × £2.40 × 2, calculated from the scenario |
| Monthly reward cost | £180 | Illustrative scenario supplied for modelling |
| Platform fee | £49 | Illustrative scenario supplied for modelling |
| Revenue less listed programme costs | £2,651 | £2,880 − £180 − £49, calculated from the scenario |
The model leaves £2,651 after the listed costs. That figure is not monthly incremental gross profit or ROI. The owner must still account for gross margin, staff time, marketing, refunds, and the difference between revenue and profit.
For a small brick-and-mortar operator, a low-cost QR platform can replace paper stamps and memory with member-linked transactions, reward redemptions, and a weekly review. Start with the café's own baseline, compare member behaviour with comparable non-member activity, and set a clear payback target before expanding the offer.
Local trading conditions will change the result. A central London café may have different visit patterns, prices, rent pressures, and commuter behaviour from a coffee shop in a market town. Use local trading data when deciding whether the reward remains affordable.
Five Common Pitfalls That Quietly Destroy Loyalty ROI
Many loyalty schemes fail through small operating decisions rather than one dramatic error. The warning signs usually appear in the till, the queue, or the gross margin before they appear in a report.
1. Rewarding everyone
A blanket reward can subsidise customers who would have returned anyway. The warning sign is rising reward cost without a clear change in visit frequency.
Use targeted rewards for lapsed customers, quieter trading periods, or valuable behaviours. A regular who already visits daily may need recognition or convenience rather than another discount.
2. Training customers to wait for discounts
Percentage discounts can teach customers that the full price is negotiable. A café may notice margin compression on filter coffee, while a salon sees customers delay bookings until an offer appears.
Use fixed-value rewards, bundles, early access, or service perks where the cost is easier to cap. The reward should encourage a profitable action, not replace full-price demand.
3. Ignoring reward liability
Issuing points or stamps without tracking future redemption creates an obligation the owner hasn't budgeted for. The early warning sign is a sudden redemption queue or a rush of customers using rewards during peak hours.
Set clear earning rules, redemption limits, and expiry conditions that customers can understand. Review outstanding rewards before increasing the offer.
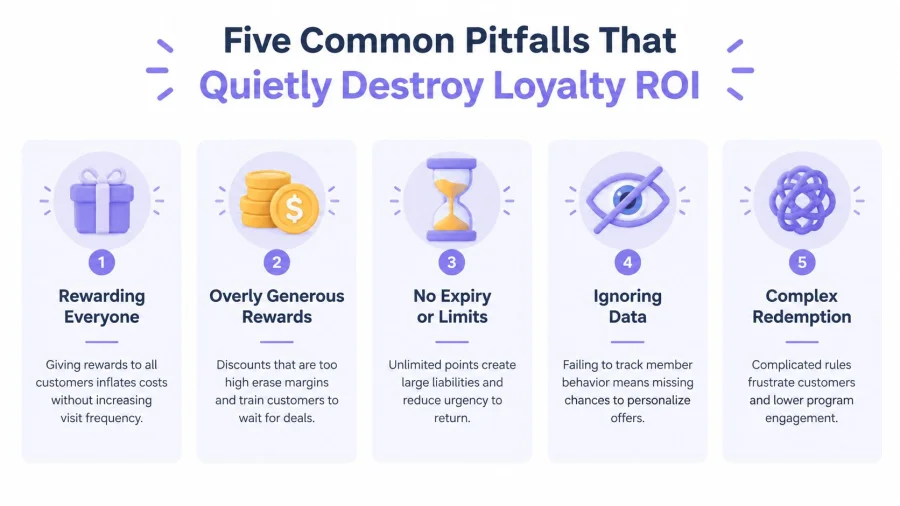
4. Treating sign-ups as success
A busy enrolment week can hide weak activation. If many people join but few return, the scheme has created a contact list rather than a profit engine.
Track first purchase, repeat visit, redemption, and member revenue. Stop celebrating the sign-up number when the member behaviour doesn't move.
5. Copying a supermarket design
A tiered structure may suit a large retailer with broad product ranges, but it can overwhelm a 40-seat venue. Staff then explain rules instead of serving customers, and members struggle to understand what they've earned.
A small operator should start with one clear action and one clear reward. Complexity earns its place only when the data shows that customers use it and the economics support it.
How a QR Based Loyalty Platform Makes ROI Easier to Measure and Improve
Paper cards create a record of stamps. A QR-based platform can create a record of customer behaviour. Each scan can connect a customer identifier with a timestamp, transaction value, and reward state, giving the owner a way to examine revisit cadence, basket size, and incremental spend in one place.
That data maps directly to the five ROI metrics. Repeated transactions inform visit frequency, basket values inform AOV, active profiles support retention analysis, and member histories make LTV more practical. The owner still needs a fair baseline, but the collection process becomes far less dependent on manual spreadsheet work.
Why the operating model matters
Customers don't need to download an app to participate in a mobile or web-based QR experience. Staff scan and redeem through the platform, while the business avoids extra hardware and can keep monthly costs visible in the ROI calculation.
The important benefit isn't novelty. It's the review cycle. An owner can check which rewards drive visits, identify members who have stopped returning, and change an offer before a full annual review. Staff spend less time replacing cards, and the business gains a consistent record of member activity.
BonusQR provides QR-based stamps, points, cashback, visit and spend thresholds, fixed discounts, welcome bonuses, birthday and seasonal coupons, plus analytics for customers, rewards, visits, and programme performance. Businesses evaluating software can browse BonusQR pricing and compare the recurring cost with the value of the measurement and redemption process.
A low-cost platform only improves ROI when the owner uses its data to remove weak rewards, protect margin, and increase profitable repeat behaviour.
Your Loyalty ROI Action Checklist and Next Step
A busy owner needs deliverables, not another strategy document. The following checklist turns the measurement problem into work that can be completed this week:
- Confirm the baseline: Record the relevant revenue, transaction, visit, member, reward, and staff-cost figures.
- Choose two metrics first: Start with visit frequency and AOV, or retention and member revenue, depending on the business model.
- Set the review date: Put a 90-day loyalty review in the calendar before launching the offer.
- Commit to one mechanic: Choose stamps, points, cashback, a visit threshold, or a fixed reward, then record its true cost.
- Select the measurement tool: Use the simplest system that links customer identity, transactions, redemptions, and reporting.
The owner's next step should be replacing paper-based uncertainty with a trackable QR scheme and a weekly review habit. BonusQR gives a small UK operator a practical way to launch, record, and assess loyalty activity, so payback becomes visible within a typical quarter rather than remaining a matter of guesswork.
Choose one reward, establish the baseline, and set up the first measurable loyalty cycle with BonusQR this week.


