
 Deutsch
 Español
 Français
 Italiano
 Magyar
 Polski
 Slovenčina
 Čeština
Median opt-in rates sit around 40 to 60% depending on platform, direct open rates typically land between 4% and 15% depending on whether the message is contextual, and click-through rates on the notifications people do open usually range from 2% to 10%. Android consistently out-opts-in iOS. Your first move: pull your own numbers this week, benchmark them against these ranges, then set a 90-day milestone instead of chasing whatever the top decile is doing.
TL;DR:
- Compare each metric with the median for your vertical, platform, and message type; investigate gaps beyond 20%, and set one 90 day milestone per metric.
- Batch measured contextual campaigns at roughly 14.4% opens versus 4.19% for generic broadcasts, so shift blanket sends toward event triggered messages.
- A screen that explains notification value before the operating system prompt can raise opt ins 10% to 15% after the app’s first useful moment.
- Track opt outs for two weeks after increasing send frequency; a rising trend calls for fewer, better targeted messages rather than simply cutting all notifications.
What do push notification benchmarks actually measure?
Push notification benchmarks track four core numbers: opt-in rate (the share of app users who allow notifications), direct open-rate (the percentage who open the app directly from tapping a notification), click-through rate or CTR (the percentage who take a further action once inside), and average monthly sends per user (how much you message people). Together they tell you whether your programme is competitive, under-performing, or simply under-tested.
The most reliable reports, including Airship’s 2025 benchmarks, present these figures as percentiles rather than single averages. The 10th percentile shows the weakest performers, the 50th (median) is the realistic mid-market target, and the 90th shows what elite senders achieve. Medians matter more than top-percentile numbers because they reflect what a well-run programme, not an outlier, achieves.
Reading these reports correctly means separating a few variables before comparing anything:
- Platform: iOS and Android have different permission prompts and therefore different opt-in ceilings.
- Message type: contextual, event-triggered messages behave nothing like generic broadcasts.
- Vertical: a travel app and a retail app have structurally different engagement patterns.
- Time window: a benchmark measured over 30 days will differ from one measured over 90.
Skip any of these splits and you will compare your gym’s push performance against an airline’s, which tells you nothing useful.
What are the current opt-in, open-rate and CTR benchmarks?
Opt-in rates vary sharply by platform. Android devices typically report higher opt-in rates than iOS, largely because Android’s default permission model is less restrictive, while iOS requires an explicit user prompt that many people dismiss on first launch, according to Airship’s percentile breakdowns. If your iOS opt-in rate trails Android by 15 to 20 percentage points, that gap is normal, not a red flag.
Direct open-rates show the widest swing of any metric, and the reason is almost entirely about targeting. Batch’s 2025 benchmark study found contextual campaigns, ones triggered by a specific user action or moment, opened at roughly 14.4%, against roughly 4.19% for generic broadcast messages sent to everyone at once. That is more than a threefold difference driven purely by relevance, not creative or copy.
Statistic callout: Contextual push messages open at nearly 3.5 times the rate of generic broadcasts (14.4% vs 4.19%), according to Batch’s benchmark data. If your programme still sends mostly blanket messages, that single distinction is the fastest lever available to you.
CTR sits downstream of the open, and it responds strongly to segmentation and rich media. Airship’s data points to rich media notifications, images, GIFs, or interactive buttons, lifting direct open-rates by around 22% compared with plain-text pushes.
A few caveats worth holding onto:
- Percentile figures are aggregated across large samples, so a single small campaign can swing wildly above or below median.
- Sample windows differ between reports, so cross-report comparisons should be treated as directional, not exact.
- CTR definitions vary by vendor; always confirm whether a number counts app-open only or a deeper in-app action.
How do push notification benchmarks differ by industry?
Vertical matters as much as platform. A push notification success rate that looks poor for a retailer might be perfectly healthy for a gaming app, because the underlying user behaviour is different.
- Retail: Lower open-rates but the highest send volume of any vertical, since promotional cadence is central to the model, according to combined industry summaries from Batch and Airship.
- Media and publishing: Among the strongest open-rate performers, driven by breaking-news and time-sensitive alerts that feel inherently contextual.
- Travel: Reports the highest opt-in rates of any sector in some datasets, occasionally reaching around 70%, because travel notifications (flight changes, boarding alerts) carry obvious personal utility.
- Finance: Moderate opt-in but high-value CTR, since alerts tend to be transactional and time-critical.
- Food and hospitality: Mid-range across the board, with opt-in and open-rates that respond well to loyalty and order-status triggers.
- Gaming: Among the lowest opt-in rates of any vertical, despite very high send frequency, largely because gaming push has a reputation for being disruptive rather than useful.
When your own business straddles categories, for instance, a hotel that also runs a restaurant loyalty scheme, compare against whichever vertical most closely matches the behaviour your notification triggers, not the industry label on your business card.
How do you turn benchmarks into a 90-day action plan?
Benchmarks are only useful once you have run your own audit against them. Here is a repeatable four-step process:
- Pull three numbers from your analytics: opt-in rate, direct open-rate, and CTR, each segmented by platform and by message type (contextual vs broadcast).
- Compare each figure against the vertical median, not the 90th percentile. Business of Apps recommends treating benchmarks diagnostically rather than as a scoreboard.
- Apply the ±20% rule: if your metric sits within 20% of the median in either direction, you are broadly on par and should focus elsewhere; outside that band signals a genuine gap worth fixing first.
- Set one SMART milestone per underperforming metric for the next 90 days, for example, “raise iOS opt-in from 35% to 42%” or “lift CTR on order-status pushes from 3% to 5%.”
Measure improvement using a consistent window, ideally 90 days against the prior 90, so seasonal noise does not masquerade as progress.
Pro Tip: *Don’t set milestones against the 90th percentile just because it looks impressive in a report.
Which quick wins actually raise your engagement numbers?
A handful of changes consistently move opt-in, open-rate and CTR without a platform overhaul.
- Add a pre-permission screen that explains the value of notifications before the native OS prompt appears, ideally right after a user’s first “aha moment” in the app. Business of Apps cites opt-in lifts of 10 to 15% from this tactic alone.
- Shift budget toward contextual, event-triggered sends rather than mass blasts; the open-rate gap between the two approaches is one of the largest in the entire dataset.
- Use rich media where the platform supports it and A/B test both copy and send time rather than guessing.
- Track opt-out rates alongside send volume. A rising unsubscribe curve is usually a frequency problem before it is a content problem.
Pro Tip: If you’re unsure whether you’re over-sending, watch the trend line on opt-outs for two weeks after any increase in send frequency. A flat line means you have headroom; a rising one means pull back before it costs you the audience entirely.
How BonusQR approaches push benchmarks for loyalty programmes
Loyalty and retention teams live or die on the same numbers covered here, which is why push notifications, automation, and real-time analytics sit inside BonusQR’s own platform rather than as an afterthought. A merchant running a stamp-card or points programme can trigger a contextual push, “you’re one visit from a free coffee”, the exact kind of event-driven message that Batch’s research shows outperforming generic blasts.
Related reading on the mechanics of this sits in BonusQR’s guide to push notifications and customer loyalty, which expands on trigger design.
- Automated, segmented push and email notifications built into the core platform.
- Real-time analytics for tracking opt-in, open-rate and CTR by campaign.
- Rapid setup with no point-of-sale integration required.
Do older or younger users behave differently with push?
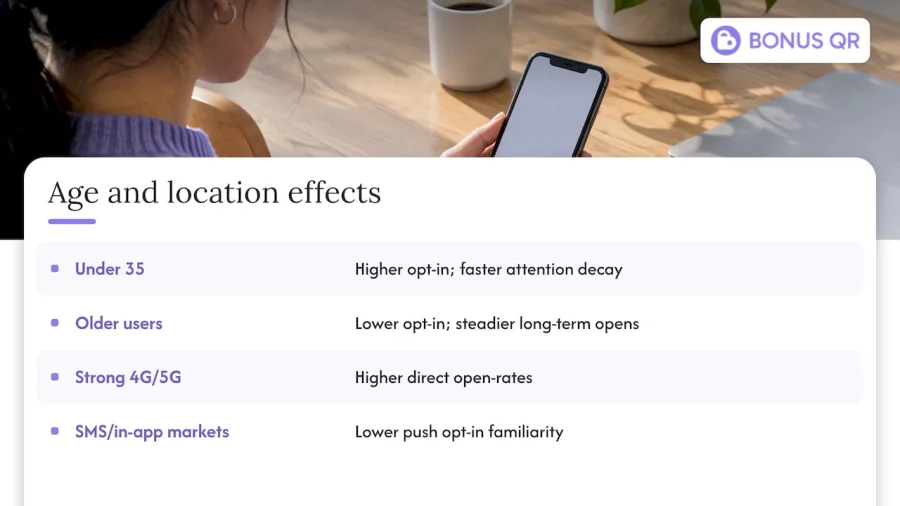
Age and location shift the ceiling on every metric discussed so far, even when platform and message type are held constant. Younger users, particularly those under 35, tend to opt in at higher rates but also churn their attention faster, meaning their engagement decays sooner after installation if the content does not stay relevant. Older demographics generally opt in less readily, often due to unfamiliarity with permission prompts, but once opted in, they tend to show steadier long-term open-rates with less notification fatigue.
Location matters through two separate mechanisms: connectivity and cultural expectations around messaging. Markets with strong 4G/5G coverage and heavy app usage generally show higher direct open-rates simply because notifications arrive and render faster. Regions where SMS and in-app messaging have historically dominated over push can show comparatively lower opt-in familiarity, which drags down first-time permission grants regardless of the app’s quality.
For a business measuring its own performance, the practical takeaway is to segment analytics by age band and, where volume allows, by region before comparing to any vertical median. A retail loyalty app skewing toward customers over 50 should not expect the same opt-in ceiling as a gaming app skewing toward users under 25, even within the same broad “retail” vertical bucket. Blending age groups into a single average tends to mask which segment is actually dragging your numbers down, which makes targeted fixes harder to design.
How does sending frequency affect opt-ins and engagement?
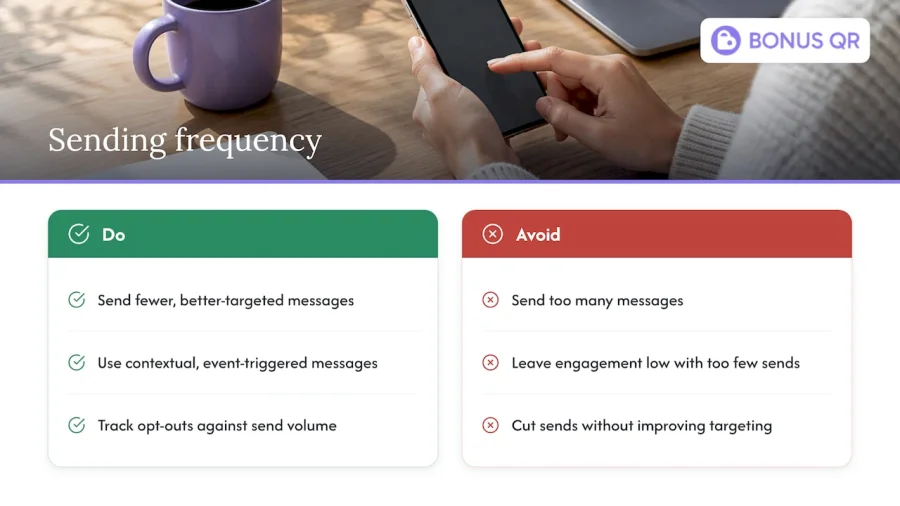
Frequency and recency interact in a fairly predictable way: too many messages erode both opt-in retention and open-rates, but too few leave engagement unnecessarily low. Verticals with naturally high send volume, retail and food being the clearest examples, need tighter frequency discipline than verticals like travel, where messages are inherently rare and high-value.
Recency compounds this. A user who received a relevant, well-timed push in the last week is measurably more likely to open the next one than a user who has not heard from the app in a month. That is part of why contextual, event-triggered messaging outperforms scheduled broadcasts so consistently, it naturally aligns frequency with actual relevance rather than an arbitrary calendar.
The practical warning sign is a rising opt-out curve that tracks against an increase in send volume. If you doubled weekly sends last month and opt-outs crept up in parallel, that is not a coincidence worth ignoring. The fix is rarely “send less” in isolation; it is usually “send fewer, better-targeted messages,” which often raises CTR even as raw volume falls. Businesses that cut broadcast frequency in half while doubling down on contextual triggers typically see both metrics improve simultaneously, because the audience stops filtering out the account entirely.
Do push notification benchmarks change over time?
Benchmarks are not fixed reference points. They shift with OS-level privacy changes, seasonal shopping patterns, and broader shifts in how comfortable users are with permission prompts generally. A benchmark pulled in January, during a post-holiday lull, will not match one pulled in November, when retail and travel sends spike alongside consumer intent.
This is why treating a single benchmark figure as permanent is a mistake. Business of Apps’ guidance on using benchmarks diagnostically implies a cadence, not a one-off check, and a quarterly review catches both seasonal swings and slower structural shifts, like platform-level permission changes that quietly move the opt-in ceiling for an entire industry.
Year-on-year comparisons are also worth tracking loosely, since industry-wide send volume has generally climbed as more businesses adopt push as a channel, which puts gradual downward pressure on generic broadcast open-rates even as contextual open-rates hold steady. That divergence itself is a trend worth watching: the gap between contextual and generic performance appears to be widening rather than narrowing, which rewards teams that shift investment toward triggered messaging earlier rather than later.
Why the “top percentile” obsession is the wrong benchmark strategy
The most common mistake marketing teams make with push notification benchmarks is treating the 90th percentile as the target, rather than the median. That instinct is understandable. Nobody wants to aim for “average.” But it is also the fastest way to set a milestone you will miss, get discouraged by, and quietly stop measuring against.
The research this article draws on, Airship’s percentile data, Batch’s contextual-versus-broadcast findings, and Business of Apps’ milestone framework, points toward a more useful conclusion: the gap between generic and contextual messaging matters more than the gap between your numbers and the industry elite. A programme that closes its contextual-versus-broadcast gap will often outperform a programme obsessed with hitting a top-decile opt-in rate while still blasting untargeted messages to everyone.
Where conventional advice falls short is in presenting benchmarks as a scoreboard rather than a diagnostic. Prioritise contextual triggers first. Everything else, rich media, timing tests, copy tweaks, compounds on top of that foundation rather than substituting for it.
— Michal
Put these benchmarks to work with BonusQR
Most of the tactics above only pay off if the underlying platform can actually run them, contextual triggers, segmentation, rich media, and analytics that let you check your numbers against a median without exporting spreadsheets by hand. BonusQR builds push notifications, automation, and real-time analytics directly into its loyalty platform, so a business can set the same 90-day milestones described here and track them from the same dashboard used to manage points, stamp cards, or cashback rewards.
Setup does not require POS integration, and plans include free and various paid tiers with white-label app options available separately. Check the BonusQR pricing page to compare tiers, or head straight to registration to start auditing your own opt-in and open-rate numbers against the ranges covered in this article.
Sources
- Mobile App Push Notification Benchmarks for 2025
- The Great Push Notifications & Mobile Engagement Benchmark 2025
- From metrics to milestones: Using benchmarks to fuel sustainable app growth
FAQ
What is a good push notification opt-in rate?
A good opt-in rate typically falls at or above the vertical median, with Android generally running higher than iOS due to differing permission prompts, according to Airship’s benchmarks.
What is a normal push notification click-through rate?
Click-through rate depends heavily on whether the message is contextual or a generic broadcast, with contextual campaigns consistently outperforming blanket sends. Batch’s data shows the open-rate gap alone reaching roughly 14.4% versus 4.19%, and CTR follows a similar pattern downstream of that open.
How often should businesses send push notifications?
Frequency should match relevance rather than a fixed schedule; verticals like retail can sustain higher volume than travel because the message triggers are inherently more frequent. Watch opt-out rates after any increase in send volume as the clearest early warning sign of fatigue.
Does BonusQR support push notifications for loyalty programmes?
Yes, push notifications, automation, and real-time analytics are built into the BonusQR platform across its plans. Current pricing and feature details are available on the BonusQR pricing page.
How often should I re-check my push notification benchmarks?
A quarterly review captures both seasonal shifts and slower structural changes, such as OS-level permission updates that move opt-in ceilings industry-wide. Comparing 90-day windows against the prior 90 days also keeps milestone tracking consistent.