
 Deutsch
 Español
 Français
 Italiano
 Magyar
 Polski
 Slovenčina
 Čeština
A retail loyalty dashboard is a digital analytics tool that pulls data from every customer touchpoint into a single visual interface, giving you a live picture of how your loyalty programme is performing. Think of it as your programme’s control panel: instead of hunting through spreadsheets or waiting for monthly reports, you see member activity, redemption rates, and revenue impact in one place. Platforms like Bonusqr are built around exactly this kind of visibility, making it practical for retail managers to act on data rather than guess at it.
The core elements you will typically find on a retail loyalty dashboard include:
- Member purchase frequency versus non-member frequency, the clearest signal of whether your programme changes buying behaviour
- Average basket size for members compared to non-members
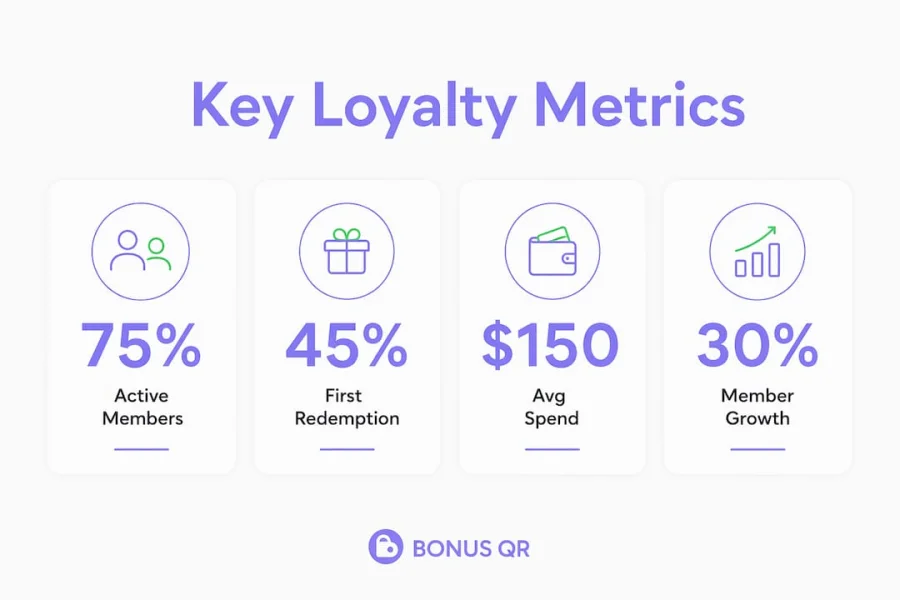
- Redemption rates, covering first redemption, active redemption, and overall programme redemption
- Active member rate, showing how many enrolled customers have transacted within the last 90 days
- Campaign performance, tracking which offers drive the most engagement
What does a retail loyalty dashboard actually do?
Loyalty analytics dashboards consolidate customer data from multiple touchpoints and present it in a visual format that supports fast, informed decisions. The key features you should expect from a well-built dashboard include:
- Real-time KPI tracking: member activity, redemption patterns, and revenue impact update continuously rather than in batches
- Customer segmentation: the dashboard identifies high-value customers, lapsed members, and churn-risk groups so you can target each differently
- Behavioural analytics: purchase patterns, visit frequency, and product preferences reveal what actually drives repeat business
- Campaign optimisation: you can see which reward structures and offers generate the strongest response, then adjust accordingly
- Omnichannel data integration: physical store transactions, app activity, and website behaviour feed into a unified customer view, which is particularly relevant for Central European retailers running both bricks-and-mortar and online channels
- User-friendly visualisations: charts, tables, and summary cards let you absorb programme health at a glance without needing a data analyst
Bonusqr adds modular analytics, push notification tools, and marketing automation to this foundation, so you can move from insight to action within the same platform.
Why loyalty dashboards pay off for retail managers
The commercial case for a loyalty analytics dashboard is straightforward. Well-designed retail loyalty programmes often achieve a significant ROI, measured by tracking incremental revenue against total programme cost. Without a dashboard, that figure is essentially invisible to you.
Beyond ROI, the benefits of loyalty dashboards include:
- Benchmarking against industry standards: you can compare your member purchase frequency against the expectation that members should transact significantly more often than non-members, and that member basket size should clearly exceed non-member basket size
- Early problem diagnosis: a drop in active member rate or a stalled first redemption rate flags a design problem before it becomes a retention problem
- Data-driven reward design: instead of guessing which rewards resonate, you see redemption data by reward type and adjust your catalogue accordingly
- Clearer ROI reporting: you can present programme performance to stakeholders with defensible numbers rather than enrolment counts
5.2x average ROI is the benchmark Antavo’s Global Customer Loyalty Report 2026 records for well-designed retail loyalty programmes, tracked through dashboards measuring incremental revenue versus programme cost.
How to use dashboard data to improve your programme
Knowing which metrics to watch is half the battle. The other half is knowing what each metric tells you when it underperforms.
Performance metrics like active member rate, first redemption rate, and member versus non-member spend differential reveal whether your programme is genuinely changing customer behaviour. A low active member rate points to an earn structure problem: customers are not finding enough reasons to keep engaging. A low first redemption rate suggests your earn threshold is too high or the redemption experience is creating friction. These are different problems with different fixes, and the dashboard tells you which one you are dealing with.
Segmentation data adds another layer. Once you know which customers are high-value and which are drifting, you can send personalised offers to each group rather than broadcasting the same message to everyone. Pairing this with customer retention strategies grounded in behavioural data tends to produce stronger re-engagement results than generic campaigns.
Pro Tip: Track first redemption rate within the first three months of enrolment as a leading indicator of long-term programme success. Customers who redeem early are significantly more likely to remain active members. If this rate is low, review your earn threshold before changing anything else.
Bonusqr’s real-time analytics let you spot these signals as they emerge and test corrective changes without waiting for a quarterly review cycle.
How Bonusqr’s dashboard supports retail decision-making
Bonusqr is built for retail managers who need both an overview and the ability to drill down. The platform’s modular dashboard lets you monitor the KPIs that matter most to your programme type, whether that is stamp card completions, cashback accumulation, or points redemption.
| Dashboard metric | What it tells you |
|---|---|
| Active member rate (90 days) | Whether your earn structure keeps members engaged after sign-up |
| First redemption rate | Whether members are reaching the programme’s core value moment |
| Member vs. non-member basket size | Whether programme participation correlates with higher spend |
| Redemption rate (12 months) | Whether your reward catalogue is perceived as worth redeeming |
| Campaign engagement rate | Which offers and channels drive the strongest member response |

The platform integrates with both mobile and web apps, covering the omnichannel reality of Central European retail. Bonusqr also supports rapid setup without requiring POS integration, which removes a common barrier for independent retailers and smaller chains. Branding customisation means the dashboard and the customer-facing app both carry your identity rather than a generic template.
What do retail loyalty dashboards look like in practice?
Across the retail sector, loyalty dashboards tend to follow a consistent structure: a summary view showing headline KPIs, a segmentation panel breaking down the member base, and a campaign layer showing offer performance. Entry-level platforms typically display basic enrolment and redemption counts. More capable platforms, including Bonusqr, layer in behavioural analytics, automated campaign triggers, and comparative member versus non-member spend data. The practical difference is whether your dashboard tells you the programme exists or whether it tells you the programme is working.
What data sources feed into a retail loyalty dashboard?
A loyalty dashboard draws from several sources simultaneously. Point-of-sale transaction data provides the spend and frequency figures. Mobile app activity adds visit data, push notification engagement, and in-app behaviour. Website interactions contribute browsing and online purchase data. Customer profile data, including demographics and communication preferences, feeds segmentation. Together, these streams give you the omnichannel picture that single-channel tracking cannot provide.
How should you design a loyalty dashboard interface?
The most effective loyalty dashboard interfaces share a few practical traits. They lead with the metrics that indicate programme health, not just programme size. They use visual hierarchy to separate headline KPIs from supporting detail, so a manager can assess status in under a minute. They make anomalies visible, flagging metrics that fall below benchmark thresholds rather than burying them in tables. Avoid cluttering the main view with existence metrics like total enrolments; reserve prominent space for performance metrics like active member rate and redemption rate. Reviewing common programme mistakes can also sharpen your sense of which metrics deserve the most attention.
What are the typical challenges with retail loyalty dashboards?
Data quality is the most common problem. If your transaction data is inconsistent or your app and in-store data are not properly linked, the dashboard reflects those gaps. Managers also sometimes focus on existence metrics, total members enrolled, points issued, and treat them as performance signals when they are not. A large enrolled base with a low active member rate is a warning, not a success. Integration complexity can also slow adoption, particularly for retailers running legacy point-of-sale systems. Choosing a platform that does not require deep POS integration, as Bonusqr does, removes that barrier from the outset.
How retailers have improved retention using loyalty dashboards
Retail businesses that shift from reporting enrolment figures to monitoring performance metrics consistently find specific, fixable problems they had not previously identified. A retailer noticing a first redemption rate well below the 25% benchmark, for example, can test a lower earn threshold and measure the impact directly in the dashboard within weeks. Another common pattern is discovering that a particular customer segment, say, customers who visit twice a month, responds strongly to a specific reward type that was previously under-promoted. The best retail loyalty programmes use exactly this kind of iterative, data-led adjustment to build retention over time rather than relying on a static programme design.
Bonusqr gives you the dashboard your loyalty programme needs
Retail managers running loyalty programmes without clear performance data are essentially flying blind. Bonusqr changes that by giving you a real-time dashboard that tracks the metrics that actually matter: active member rate, redemption performance, basket size differentials, and campaign engagement, all in one place and without requiring POS integration.
Whether you are launching a digital loyalty card for the first time or looking to get more from an existing programme, Bonusqr’s modular platform fits your scale. You can start with the core analytics and add push notifications, automated campaigns, and a branded app as your programme grows. Visit bonusqr.com to set up your account and start tracking what your loyalty programme is genuinely delivering.
Key takeaways
A retail loyalty dashboard is only as useful as the performance metrics it tracks; enrolment figures alone tell you nothing about commercial impact.
| Point | Details |
|---|---|
| Performance over existence metrics | Track active member rate, first redemption rate, and spend differentials rather than enrolment counts. |
| Industry benchmarks to know | Member purchase frequency and basket size should be notably higher for members compared to non-members. |
| ROI potential | Well-designed programmes achieve an average 5.2x ROI, measurable only through dashboard tracking of incremental revenue. |
| Early warning signals | A first redemption rate below 25% or a low active member rate signals a design problem requiring a specific fix. |
| Bonusqr for Central European retail | Bonusqr provides a modular, real-time loyalty dashboard with no POS integration required, suited to independent retailers and growing chains alike. |