
 Deutsch
 Español
 Français
 Italiano
 Magyar
 Polski
 Slovenčina
 Čeština
76.8 out of 100 was the UK Customer Satisfaction Index score in January 2024, down from 78.1 in January 2023. That drop matters because satisfaction only becomes retention when customers have a clear reason to come back, and many local shops never build that bridge.
Customer satisfaction and customer retention get blurred together all the time, especially by operators who are busy trying to keep tills ringing. In practice, they are two different numbers. One tells you how people felt about the last visit, the other tells you whether they came back, renewed, or kept spending. In a brick-and-mortar business, that gap is where margin gets lost.
The national backdrop is clear. The UKCSI is widely used as a benchmark for service quality, loyalty, and repeat-business intent across sectors, and the same release notes that recommendation intent slipped while likely reuse remained a key retention signal UK customer satisfaction statistics. That mix is the key problem for cafés, salons, gyms, restaurants, and retail shops, because a pleasant visit is no longer enough when a competitor is one tap away.
Why Customer Satisfaction and Customer Retention Matter More in 2026
The pressure on independent shops is simple. Customers compare, switch, and forget faster than ever, so a warm smile at the counter is only part of the equation. A business can score well on satisfaction and still leak repeat visits if it doesn't give people a reason to return, and that gap is exactly where a lot of paper punch cards fall apart.
The UK evidence points in the same direction. PwC's UK consumer research found that 32% of customers would stop doing business after one bad experience, and 59% would walk away after several bad experiences PwC UK consumer research summary. That makes service consistency a retention lever, not a soft nice-to-have.
Why the satisfaction score alone can mislead
Satisfaction is a feeling about the visit. Retention is behaviour over time. Those are related, but they're not interchangeable, and the distinction matters in habitual sectors such as coffee, beauty, fitness, and convenience retail. A customer can be satisfied and still choose the cheaper, nearer, or easier option next time.
That is why a shop owner needs a loyalty layer, not just good service. Paper cards are easy to lose, hard to measure, and almost impossible to connect to customer history. QR-based loyalty systems do the opposite, they make the return path visible and give the business a way to reward the next visit instead of hoping the last one was memorable enough.
Practical rule: if a customer can enjoy the visit and still leave without friction, satisfaction is not yet turning into retention.
The real question owners need to answer
The question isn't whether customers liked the latte, haircut, or membership class. The question is whether they came back, and if not, why not. The rest of the article focuses on the numbers that reveal the answer, the mechanics that improve it, and the mistakes that block it.
The Five Metrics That Actually Predict Repeat Business
A small operator doesn't need a giant analytics stack to understand retention. It needs five numbers that work together. Used properly, they show whether customers are happy, whether they return, and whether the business can justify keeping spend behind loyalty, ads, or win-back campaigns.
The five numbers in plain English
CSAT measures how satisfied customers are after a visit or interaction. In a café, that could be a quick QR survey after coffee collection. In a salon, it could follow the checkout desk. Formula: satisfied responses divided by total responses. The data usually comes from a short post-visit survey.
NPS measures willingness to recommend. In a restaurant, it often captures whether people would tell friends to try it. It doesn't prove repeat business, but it helps surface attitude and advocacy. Formula: promoters minus detractors. The data comes from a recommendation survey.
Churn rate shows who stopped coming back in the period you're measuring. A salon owner might use it to see how many regular clients vanished over a month. Formula: customers lost divided by starting customers. The data comes from till exports or a loyalty platform.
Retention rate is the share of customers who stayed active across the same period. A gym can track whether members checked in again after the first month. Formula: retained customers divided by starting customers. The data comes from transaction logs, visits, or memberships.
Customer lifetime value estimates the value of an average customer over time. A retail shop uses it to decide whether a discount or reward is worth funding. Formula: average order value multiplied by purchase frequency and customer lifespan, though the exact method varies by business. The data comes from sales history and repeat-visit records.
| Metric | What it measures | Simple formula | Where to source the data |
|---|---|---|---|
| CSAT | How satisfied customers felt | Satisfied responses ÷ total responses | QR survey, form, app feedback |
| NPS | Likelihood to recommend | Promoters minus detractors | Short post-visit survey |
| Churn rate | Customers lost in a period | Lost customers ÷ starting customers | Till export, loyalty report |
| Retention rate | Customers kept in a period | Retained customers ÷ starting customers | Till export, membership list |
| Customer lifetime value | Expected value per customer | Average value × frequency × lifespan | Sales history, repeat records |
How the numbers fit together
CSAT and NPS are early signals. Churn and retention tell the truth about behaviour. LTV turns that truth into a budget decision, because a business can only defend loyalty spend if repeat visits are worth more than the cost of earning them. That measurement chain is what stops “nice to have” loyalty from becoming a vanity project.
Satisfaction Is Not Retention and Why That Gap Costs You Money
A happy customer is not the same thing as a loyal one. The mistake is common because good service feels like it should naturally produce repeat business, but habit-driven sectors don't work on sentiment alone. Price, convenience, and switching friction often win.
PwC's UK research makes that risk obvious. If 32% of customers can leave after one bad experience and 59% after several, then one messy visit can undo months of careful service PwC UK consumer research summary. That's not just a customer service issue, it's a revenue issue.
Why customers leave even when they say they're happy
A customer can like the staff, the product, and the atmosphere, then still drift to a competitor because it's closer, cheaper, or easier to use. That happens constantly in cafés and quick-service food, where the “good enough” alternative is never far away. It also happens in salons and gyms when routines change and the business offers no reason to keep the habit alive.
The core problem is that satisfaction measures emotion, while retention measures inertia plus incentive. If the business doesn't offer a deliberate return trigger, the customer has no reason to convert a good visit into a second one.
The bridge between feeling good and coming back
That bridge is loyalty mechanics. A stamp card, a point balance, a spend threshold, a tier, or a recurring perk gives the next visit a purpose. It turns memory into momentum.
A customer rarely returns because the last visit was pleasant alone. They return because the next visit feels rewarded, easier, or both.
This is why generic CSAT content misses the point for brick-and-mortar SMBs. Satisfaction is the start. Retention needs a mechanism.
How to Calculate Retention Rate and Churn Without a Data Team
Retention and churn do not need a data team. They need one clean time window, a starting list of active customers, and a way to see who came back. For most independent shops, a till export or loyalty report is enough to get a usable answer.
A simple spreadsheet method
Start with one month. Pick the customers who were active at the beginning of that month, then count how many of those same customers made another purchase before the month ended. That group is your retained cohort.
The formula is straightforward, retention rate = retained customers ÷ starting customers. Churn rate = 1 minus retention rate when you use decimals, or 100% minus retention rate when you use percentages.
Logo churn and revenue churn are different problems. A salon can lose a few low-spend clients and barely feel it, while losing two high-spend colour clients can hurt cash flow much more than logo churn suggests. A simple customer count still helps, but it does not tell the full story for services with uneven basket sizes.
Useful habit: look at the same period twice, once by customer count and once by spend. Otherwise the real damage can hide in plain sight.
Two mistakes that distort the number
The first mistake is picking the wrong time window. A weekly coffee shop and a monthly membership business do not behave the same way, so the measurement period has to match the visit cycle. The second mistake is counting new customers as retained customers, which flatters the number and makes the repeat engine look healthier than it is.
For a quick self-check, ask one question. If the same customers disappeared tomorrow, would the business feel it? If the answer is yes, churn is real and the retention number needs attention.
Here is a simple reference for the process.
| Step | Action | Why it matters |
|---|---|---|
| 1 | Extract monthly transaction data | Gives the raw customer list |
| 2 | Define the cohort | Keeps the sample consistent |
| 3 | Track repeat purchases | Shows who came back |
| 4 | Calculate retention rate | Measures the repeat share |
| 5 | Calculate churn rate | Shows the leakage |
| 6 | Plot trends monthly | Reveals patterns and seasonality |
For a deeper formula walkthrough, the guide to evaluate business retention is the cleanest place to start. Food-led businesses that want to keep the visit consistent after the meal can also use food packaging branding tips to make the takeaway touchpoint feel connected to the visit.
Vertical Playbooks for Cafés, Restaurants, Salons, Gyms and Retail
Different businesses need different loyalty mechanics. A coffee shop does not behave like a gym, and a salon does not reward the same way a grocery aisle does. The best programme matches the visit pattern, the basket size, and the reason customers return.
What fits each sector
Cafés usually win with stamps and fast repeat triggers. Daily or near-daily visits suit a simple “buy, scan, earn” flow, because the value is obvious and the reward feels close. A digital stamp card inside a QR system works better than paper because it survives a lost wallet and gives the business actual visit history.
Restaurants often need tiered points, welcome bonuses, and seasonal rewards, especially when the goal is to push people from first visit to second and then to habitual dining. A practical reference is how restaurants use loyalty, because menu-driven businesses often need more than one reward rule. For packaging or take-home items that shape the brand outside the plate, food packaging branding tips can help keep the experience consistent after the meal ends.
Salons do well with birthday coupons, spend thresholds, and rebooking nudges. The return cycle is longer, so the reward has to feel personal rather than frequent. A tiered setup can also reward higher-value services without giving away margin on every visit.
Gyms need visit streaks, milestone rewards, and occasional retention nudges. The goal is to keep the habit alive, not just to hand out discounts. A bonus after a defined number of visits can create momentum without turning the membership into a permanent sale.
Retail shops often perform best with category-based cashback, welcome bonuses, and spend thresholds. The reward should match purchase intent, especially when customers buy across different product groups. That makes the mechanic feel relevant instead of generic.
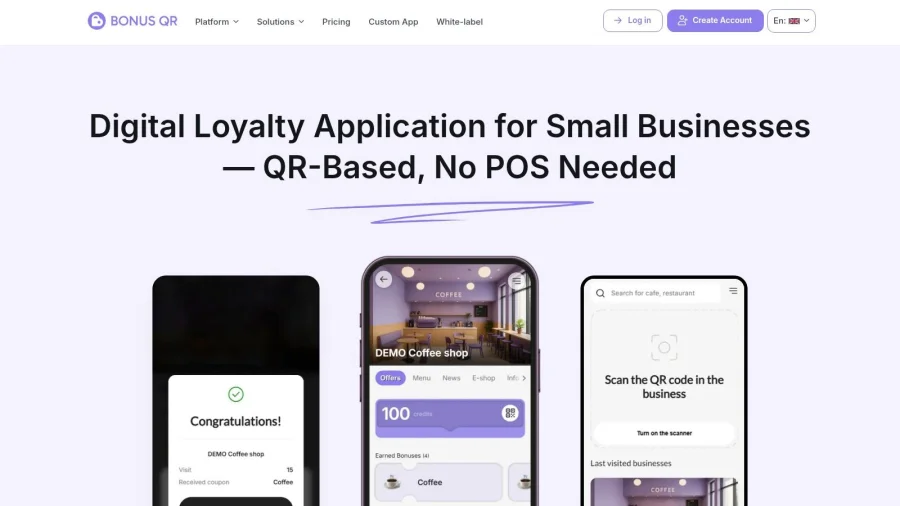
A QR loyalty layer ties these ideas together because it lets staff scan quickly, track visits, and deliver the right reward without extra hardware. One example is BonusQR, which supports stamps, points, cashback, visit thresholds, birthday coupons, wallet passes, and automated reminders in a single system.
Common Pitfalls That Quietly Destroy Retention
Most retention problems don't come from one big failure. They come from a string of small mistakes that look harmless until repeat visits start falling away. The owner often doesn't notice because the surface numbers still look busy.
The five mistakes that do the most damage
Chasing vanity metrics. A high recommendation score can look reassuring while repeat visits stay flat. The fix is to review actual return behaviour every month, not just sentiment surveys.
Collecting data without using it. Many businesses gather birthdays, emails, or visit history, then never act on them. The fix is to tie every field to one concrete action, such as a birthday reward, a win-back message, or a visit-based offer.
Hiding cancellation or opt-out flows. This is especially damaging in recurring services, because frustration at exit turns into distrust before the next renewal. The fix is to make leaving, pausing, or changing the plan clear and easy.
Rewarding visits but not spend. A customer who comes often is valuable, but so is the customer who buys more per visit. The fix is to use mixed rules, so a spend threshold or bonus can sit beside the visit mechanic.
Copying a big-brand tier structure that doesn't fit a small base. A local shop rarely has enough volume for a complicated ladder of levels and exceptions. The fix is to keep the rule set simple, visible, and easy to explain at the till.
UK regulatory guidance also matters here. The Competition and Markets Authority says subscription businesses must make cancellation easy and must not rely on hidden consent or unclear renewal terms, because those journeys affect complaints and trust UK customer satisfaction and retention guidance. The Data Protection Act 2018 and GDPR add another layer, because customer data must be collected lawfully, fairly, transparently, and only for necessary purposes UK data protection guidance.
The best retention systems are not flashy. They're disciplined.
Using QR Loyalty and Wallet Passes to Close the Loop
Paper punch cards create a memory of effort. QR loyalty creates a record of behaviour. That difference matters because the business needs more than goodwill, it needs a usable loop from visit to insight to offer.
What the loop looks like in practice
A customer scans a QR code at the till or on a counter display. Staff redeem the visit instantly, and the system logs the transaction against that profile. The dashboard then shows who visits most often, which rewards get redeemed, and which coupons are effectively moving people back through the door.
That's where wallet passes and mobile access help. A customer can keep the loyalty pass in Apple Wallet or Google Wallet, which makes the programme harder to forget and easier to open at the counter. For shops that want a simple mobile setup, mobile wallet loyalty solutions are a clean fit because they keep the reward visible without adding hardware.
Why this beats paper cards
Paper cards are hard to measure and easy to abandon. QR systems capture data, support quicker sign-up, and make follow-up possible. They also let the operator send a timely reminder, a birthday reward, or a reactivation offer based on actual behaviour instead of guesswork.
The data side still needs care. Under ICO-style privacy principles, customers should know what data is collected, why it is used, and how long it will be kept. That means a clear privacy notice, a lawful basis for processing, and no unnecessary data hoarding, especially if the programme collects birthdays, contact details, or purchase history.
The loyalty tool should reduce friction for the customer and reduce guesswork for the owner. If it only does one of those, it's incomplete.
Your 30-Day Customer Retention Action Plan
A good retention reset does not need a huge rollout. It needs one month, a clear mechanic, and enough discipline to measure what changed. The fastest path is to start with a simple system, launch it properly, then refine based on what the numbers say.
Week-by-week plan
Week 1, measurement. Pull a baseline from till data or a loyalty report. Record current retention, churn, and one satisfaction check so there's a starting point. Without a baseline, every later improvement turns into guesswork.
Week 2, mechanic design. Choose one rule set. A café can start with stamps, a salon can use spend thresholds plus birthday offers, and a gym can use streak-based rewards. Keep it simple enough that a staff member can explain it in one sentence.
Week 3, launch. Put the QR sign at the till, teach the team the sign-up script, and make the reward visible. If the programme supports wallet passes, get the pass onto the customer's phone while the visit is still fresh.
Week 4, optimisation. Review which customers joined, which rewards were redeemed, and which offers got ignored. Then send one follow-up campaign, such as a birthday note, a win-back message, or a revisit reminder.
The goal is not perfection. The goal is a repeatable system that connects satisfaction to behaviour. For operators who want to move quickly, start by setting up a free loyalty tier in BonusQR, then use the first 30 days to learn which reward brings customers back.