
 Deutsch
 Español
 Français
 Italiano
 Magyar
 Polski
 Slovenčina
 Čeština
Send no more than two to four push notifications a week as a starting default, then let personalisation and relevance override that number for individual users. Research links generic, high-frequency pushes to rising uninstall rates and falling direct open rates, so the goal is never a fixed cadence but a tested one. Segment your users, map message type to purpose, and measure the results before you settle on a final rhythm.
TL;DR:
- A retail experiment tracking 17,500 users over seven weeks found that each extra weekly notification cut direct opens about 12.67% and raised uninstall probability.
- Cadences should vary by engagement: active users can receive three to four weekly messages, at risk users one or two, and churned users one reengagement attempt.
- Keep transactional confirmations and critical alerts outside promotional caps, but suppress promotional sends after conversion, cap weekly volume across campaigns, and honor user preferences.
- Randomize users into zero, one, and three weekly promotional sends, then track opens, opt outs, uninstalls, and conversions for four to six weeks.
Data and benchmarks for setting your cadence
Before you pick a number, it helps to know what the data actually shows. Benchmarks vary by industry, so treat these as starting anchors rather than fixed rules.
- A retail app experiment with 17,500 users found that each additional weekly notification reduced the direct open rate by roughly 12.67%.
- Sampled European news outlets averaged around 2.3 notifications per day, though cadence varied widely between outlets.
- A large-scale pre-analysis plan tested groups receiving between 0 and 5 weekly notifications across one million users to study the trade-off between visits and opt-outs.
- Ecommerce teams often use cart-abandonment data to decide when a re-engagement push is worth the risk of fatigue.
Statistic to anchor your planning: one additional generic push per week cut direct opens by roughly 12.67% in a controlled retail experiment, which means the cost of an extra message is measurable, not theoretical.
News publishers can sustain a daily cadence because readers expect frequent updates. Retail and loyalty apps face a different equation: users expect relevance more than volume, so the benchmarks from retail experiments matter more to loyalty marketers than publishing norms do.
What controlled studies show about frequency’s direct effects
The clearest evidence comes from field experiments, not surveys, because they isolate frequency as the variable under test.
- The retail experiment with 17,500 users split participants into five frequency groups over seven weeks and found that uninstall probability rose as frequency increased, while direct open rates fell with each additional weekly message.
- A companion analysis of the same dataset found that indirect opens, meaning user-initiated app visits, were not significantly harmed by higher frequency, suggesting relevant content can sustain engagement even at a higher cadence.
- A larger, randomised pre-analysis plan covering one million users describes groups receiving zero to five weekly notifications, built specifically to measure the trade-off between increased visits and rising opt-outs.
Higher frequency can increase visits and coupon redemption, but it also raises opt-outs, and the effect differs enough across users that a single frequency cap underperforms a personalised rule.
That line from the pre-analysis research captures the core tension you are managing: more messages can drive short-term activity, but the same volume erodes the audience you are trying to keep. The practical takeaway is to separate generic blasts from targeted, behaviour-driven notifications. A message tied to an actual stamp card near completion or a reward about to expire behaves differently from a blanket promotional blast, even at the same frequency.
How to choose the right frequency for your app
A workable cadence starts with segmentation, not a single number applied to everyone.
- Segment your users first. Active, highly engaged users can typically absorb three to four messages a week; at-risk or dormant users respond better to one or two carefully timed messages; churned users often need a single, high-value re-engagement attempt before you stop.
- Map message type to purpose. Transactional messages, such as order confirmations, go out as needed regardless of cadence limits; critical alerts follow the same rule; promotional and re-engagement messages are the ones that need frequency discipline, typically starting at one to three a week.
- Build suppression logic before you scale. Exclude recent converters from promotional sends for a set period, cap total weekly messages across all campaigns combined, and always respect any frequency preference a user has set.
- Review and adjust monthly. Treat your starting cadence as a hypothesis, not a policy, and revisit it as soon as you have enough data to test it.
Pro Tip: Keep promotional push frequency conservative in the first month of a new loyalty programme: it is easier to raise cadence for engaged users later than to win back someone who uninstalled early.
How to test cadence scientifically
Guessing at the right number wastes the audience you have worked to build, so testing beats intuition here.
- Create randomised frequency arms, for example zero, one, and three weekly pushes, and hold out a control group that receives no promotional messages at all.
- Run the test for at least four to six weeks to capture delayed uninstall behaviour, since the retail research found uninstalls often occurred between consecutive notifications rather than immediately.
- Track direct opens, indirect opens, uninstall rate, and downstream conversion, not opens alone.
- Short-term metrics: open rate, click rate, redemption rate.
- Long-term metrics: uninstall rate, opt-out rate, retention at 30 and 90 days.
- Where you have the data volume, personalised relevance scoring or causal modelling can outperform a single frequency cap, echoing the approach proposed in the large-scale pre-analysis plan.
Balance the two sets of metrics against each other. A cadence that lifts short-term clicks but accelerates uninstalls is not a win, even if the weekly dashboard looks good.
Operational tips for implementing push frequency
Good cadence policy fails without the operational controls to enforce it.
- Set hard rate limits per user across all campaigns, not per campaign, so a loyalty blast and a reminder never stack in the same hour.
- Respect quiet hours and local time zones; a message sent at 2am local time damages trust regardless of its content.
- Deduplicate and throttle overlapping triggers so a single customer action never fires two near-identical notifications.
- Frame your opt-in request around the experiential value of joining, since framed opt-in prompts significantly increase acceptance compared with a plain, unexplained request.
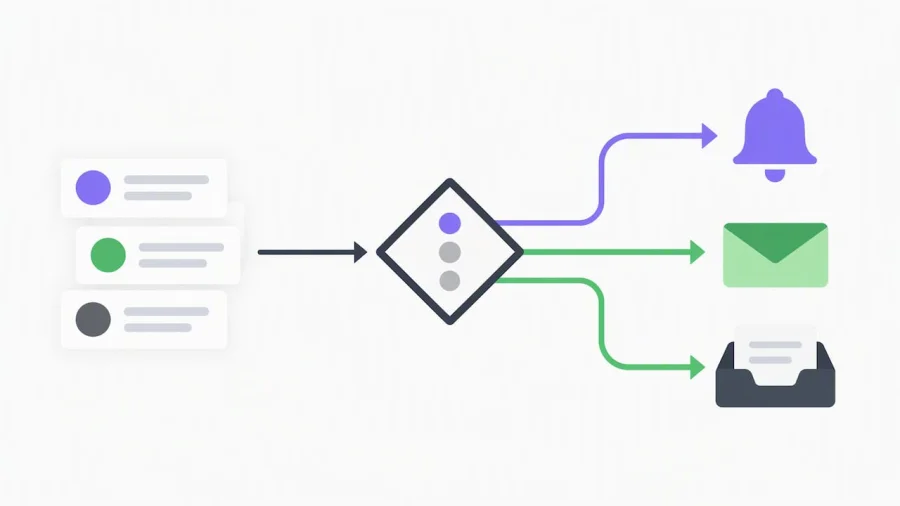
A common mistake is treating every channel as push’s job. Email and in-app messages can absorb lower-priority updates, leaving push for moments that genuinely need immediate attention.
Pro Tip: Spread lower-urgency updates across email or in-app inboxes so push stays reserved for your highest-value moments, which keeps acceptance rates higher over time.
A practitioner’s view on disciplined cadence
Running loyalty campaigns for small businesses, we have watched the same pattern repeat: the operators who measure cadence outperform the ones who guess. Discipline here is not about sending less for its own sake, it is about matching message volume to actual relevance, then letting segmentation and automated analytics do the heavy lifting that manual guesswork cannot.
— Michal
Where BonusQR fits into your push strategy
If you are setting up a loyalty programme and want cadence control built in rather than bolted on, BonusQR gives you the tools to apply everything above without technical complexity.
- Built-in push notifications alongside stamp cards, points, and cashback modules, so messaging ties directly to loyalty activity.
- Segmentation and automated campaigns that let you target active, at-risk, and high-value customers differently.
- Real-time analytics to track opens, redemptions, and engagement by segment.
- Rapid setup with no POS integration required.
Check our pricing page to compare the Free, Basic, and Premium plans and find the tier that matches your current loyalty volume.
FAQ
What is a good open rate for push notifications?
There is no single universal benchmark, since open rates depend heavily on message relevance and audience type. The retail experiment found that direct open rates fell by roughly 12.67% for each additional weekly notification, so a falling open rate as frequency rises is the pattern to watch rather than a fixed target number.
Is there a difference between notifications and push notifications?
Notifications is the broader term covering any alert on a device, including in-app messages, email alerts, and system notifications. Push notifications specifically are messages sent from a server to a user’s device even when the app is closed, which is why their frequency and timing carry more weight on uninstall decisions.
How many push notifications are too many?
The threshold varies by audience and message relevance, but field research shows the risk rises sharply with each additional weekly send: one extra generic push per week reduced direct opens by roughly 12.67% in a controlled retail experiment, while a separate large-scale study found opt-outs increasing alongside frequency. Starting at one to three promotional messages a week and testing from there is a safer approach than guessing at a ceiling.
How do I automate push notification scheduling?
Automation works best when it is tied to user behaviour and segmentation rather than a fixed calendar. Platforms such as BonusQR let you automate campaigns by segment, so active customers, at-risk customers, and recent converters each receive different cadences without manual scheduling.
Sources
- Mobile apps in retail: Effect of push notification frequency on app user behavior
- Pushing to the limit: a pre-analysis plan for push frequency experiments
- The temporal nature of mobile push notification alerts: A study of European news outlets’ dissemination patterns
- Online shopping cart abandonment rate worldwide | Statista