
 Deutsch
 Español
 Français
 Italiano
 Magyar
 Polski
 Slovenčina
 Čeština
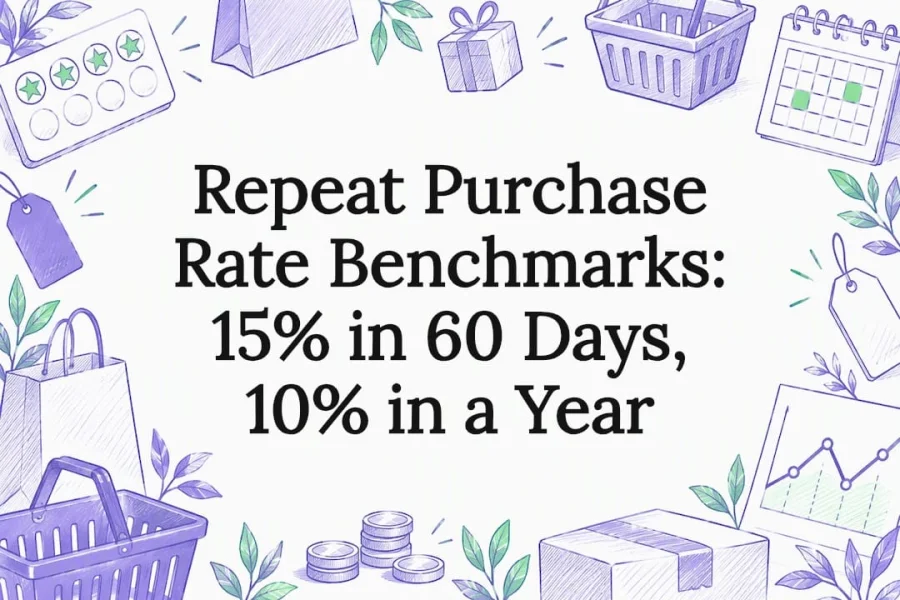
A typical repeat purchase rate for e-commerce generally falls within a moderate range over a 12 month window, though exact expectations shift with product type and business model. Consumables often repeat faster than durable goods, and subscriptions follow a different logic altogether. Where you land depends on what you sell, how often customers naturally need it and whether a tool like BonusQR is already working behind the scenes to bring them back.
TL;DR:
- Use 30 days for consumables, 90 days for mid cycle goods, and 365 days for durable products; subscriptions require renewal and churn metrics.
- A widely cited benchmark is about 15% repeat purchases within 60 days for consumables, compared with roughly 10% within 365 days for nonconsumables.
- Calculate the rate by dividing repeat customers by all customers and multiplying by 100; keep windows consistent and check returns, seasonality, and small cohorts.
- Compare cohort retention, repurchase lag, and customer churn, then segment results by acquisition source and tenure instead of relying on one blended storewide rate.
- Simplify reordering and time replenishment reminders as quick wins; test each change against a control group and track redemption, purchase gaps, and repeat rates.
What repeat purchase rate is and how to calculate it
Repeat purchase rate measures the share of your customers who buy from you more than once within a given period. It tells you whether your business earns ongoing loyalty or depends constantly on new buyers to replace the ones who never return.
The standard formula is straightforward: divide the number of repeat customers by your total number of customers, then multiply by 100. If 200 of your 1,000 customers bought a second time, your repeat purchase rate is 20%.
Practitioners typically measure this across one of three windows:
- 30 days for fast-moving consumables where repurchase cycles are short.
- 90 days for mid-cycle goods such as cosmetics or supplements.
- 365 days for durable goods, apparel and anything with a longer natural replacement cycle.
Common pitfalls undermine the figure before you even compare it to a benchmark. Mixing windows between reporting periods, miscounting returns as separate purchases, and ignoring small cohort sizes all distort the result, as do seasonal spikes that make one quarter look stronger than your business really is.
Benchmarks: typical ranges by sector and by time window
Benchmarks only mean something when you compare like with like. A consumables brand and a furniture retailer should never be judged against the same number, because their customers buy on entirely different clocks.
A widely cited guideline suggests around 15% of customers repeat within 60 days for consumables, against roughly 10% within 365 days for non-consumable goods, according to metric documentation from Vision Labs. That gap reflects how quickly a product gets used up and needs replacing, not how good the brand is at retention.
Roughly, expect these patterns across product types over a 12 month window:
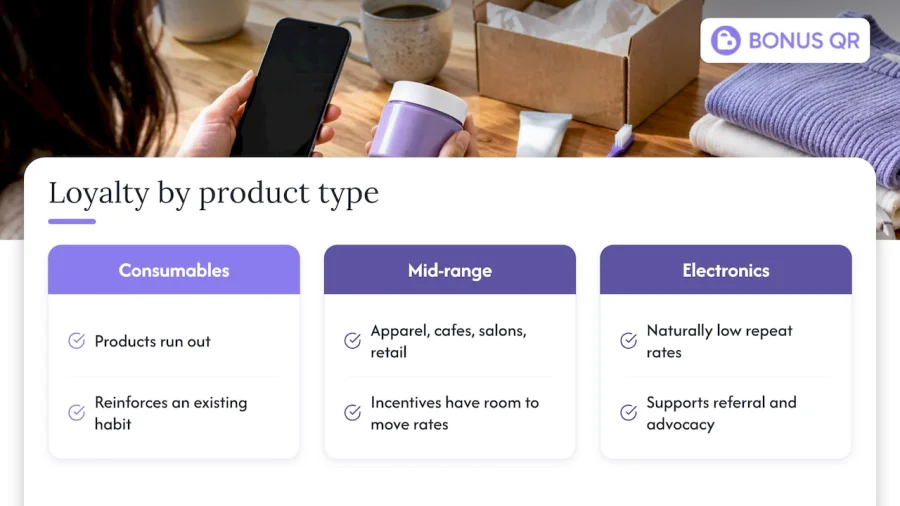
- Consumables (food, personal care, pet supplies): higher repeat rates, often reaching the stronger end of typical e-commerce ranges because products run out and get reordered.
- Apparel and accessories: moderate rates, shaped heavily by seasonality and style changes.
- Electronics and durable goods: lower rates, since a single purchase can satisfy a need for years.
- Subscriptions: a different metric entirely, where renewal and churn matter more than a simple repeat count.
Shorter windows like 30 or 90 days suit businesses with fast repurchase cycles and give you an early read on momentum. A 365 day window suits almost everything else, since it smooths out seasonal noise and gives durable goods, apparel and mixed-basket retailers enough time to show a genuine second purchase. Treat any benchmark as a range rather than a target number: sample size, dataset source and how “customer” is defined all shift the figure, sometimes by several points.
How to interpret your repeat purchase rate and related metrics
A repeat purchase rate on its own tells you less than it seems to. Pair it with purchase frequency, average order value and customer lifetime value, and the picture sharpens considerably: a modest repeat rate alongside a high average order value and a long natural repurchase cycle can still add up to a healthy, sustainable business.
A low repeat purchase rate is not automatically a problem. Furniture, mattresses and major appliances all carry naturally low repeat rates because customers simply do not need to buy again for years.
Before judging your number, check a few diagnostics:
- Cohort retention over time, to see whether repeat behaviour is improving or fading by signup month.
- Repurchase lag, the typical gap between first and second order, to confirm you are using the right measurement window.
- Churn among customers who should be repeating but have not.
Pro Tip: Set staged targets rather than one fixed goal: an early-stage store might aim for steady month-on-month improvement, while a mature brand should benchmark against its own historical best.
Proven tactics to improve repeat purchase rate
Improving repeat purchase rate rarely comes down to one clever campaign. It comes from making the second, third and fourth purchase easier and more rewarding than the first.
- Launch a loyalty programme that rewards points, stamps or cashback on every visit or purchase.
- Set up replenishment reminders timed to when a consumable product is likely running low.
- Offer a subscription option for products customers buy on a predictable schedule.
- Personalise cross-sell suggestions based on what a customer has already bought.
- Simplify reorder flows so a repeat purchase takes one tap, not a full checkout again.
- Send SMS or push reminders tied to specific triggers rather than generic blasts.
Prioritise by effort against reward: reorder simplification and replenishment reminders tend to be quick wins, while a full loyalty programme takes longer to launch but compounds over time. Track redemption rate, time between purchases and repeat rate itself before and after each change, and run simple A/B tests, one audience segment with the new flow and one without, before rolling anything out fully.
A loyalty platform can tie several of these levers together in one place: automated reminders, points or stamp tracking and reward redemption all sit inside a single system rather than scattered across separate tools. For retailers juggling replenishment timing, personalised offers and reorder convenience at once, that consolidation is often what turns a good tactic into a repeatable habit. You can read more proven retention strategies if you want a deeper implementation playbook.
Worked example: calculate repeat purchase rate for a 12 month window
Say your store had 4,000 customers over the past 12 months, and 920 of them made more than one purchase in that period.
- Divide repeat customers by total customers: 920 ÷ 4,000.
- Multiply by 100 to express it as a percentage: 23%.
- Compare that 23% against the relevant benchmark range for your product type and window.
Round to one decimal place when reporting internally, and always note the window and customer definition alongside the figure so nobody misreads it later.
How repeat purchase rate benchmarks vary by customer segment
A single storewide repeat purchase rate hides more than it reveals. New customers and loyal, long-tenure customers behave so differently that blending them into one number flattens the signal you actually need.
First-time buyers typically convert to a second purchase at a noticeably lower rate than customers who have already bought two or three times, simply because trust and habit build with each transaction. Once someone becomes a repeat customer, their likelihood of buying again climbs further, which is why many businesses track a “second to third purchase” rate separately from “first to second.”
Demographic and acquisition-channel differences matter too. Customers who arrive through a referral or a loyalty sign-up tend to show stronger repeat behaviour than those acquired through a one-off discount code, because the initial relationship started on different terms.
Segmenting your reporting by acquisition source, tenure and even order value band gives you a far more honest read than a single blended figure. Treat the blended rate as a headline, but make segment-level rates the number you actually act on.
Impact of seasonality and market trends on repeat purchase rate benchmarks
Seasonality can make a repeat purchase rate look better or worse than your underlying business performance actually is. A gift-heavy retailer measured only across November and December will show inflated repeat activity driven by holiday shopping patterns rather than genuine loyalty.
Measuring across a full 12 month window helps smooth these spikes out, which is one reason it remains the most common window for cross-business comparison. Shorter windows are useful for spotting momentum, but they are far more exposed to seasonal distortion and should be read with that caveat attached.
Broader market trends shift expectations over time as well. Shifts in consumer spending, rising digital loyalty adoption and changing shopping habits can all move the baseline up or down across a sector within a year or two, which is part of why benchmarks are best treated as a range rather than a fixed target. Comparing your rate only against last year’s figure for your own business, alongside the general sector range, usually gives a steadier read than chasing an external number that may already be out of date.
Using repeat purchase rate benchmarks to set realistic business goals and KPIs
Benchmarks are a starting point for setting targets, not a target in themselves. A sector range tells you roughly where competitors land, but your own historical trend tells you whether you are actually moving in the right direction.
A practical approach sets two layers of goals. The first is a sector-informed floor, the lower end of the relevant benchmark range for your product type and window, which flags a genuine problem if you consistently sit below it. The second is a self-referential target, improving your own quarter-on-quarter or year-on-year figure, which matters more day to day than hitting an external number exactly.
Early-stage businesses should expect to sit below mature-brand benchmarks for a period while loyalty habits form, so a staged target of steady improvement month to month is more useful than demanding immediate parity with established players. Build repeat purchase rate into a short dashboard alongside purchase frequency and average order value, review it monthly, and treat any sudden drop as a trigger to check for seasonality, a changed acquisition mix or a broken reorder flow before assuming a deeper retention problem.
How to collect and utilise data for benchmarking repeat purchase rate effectively
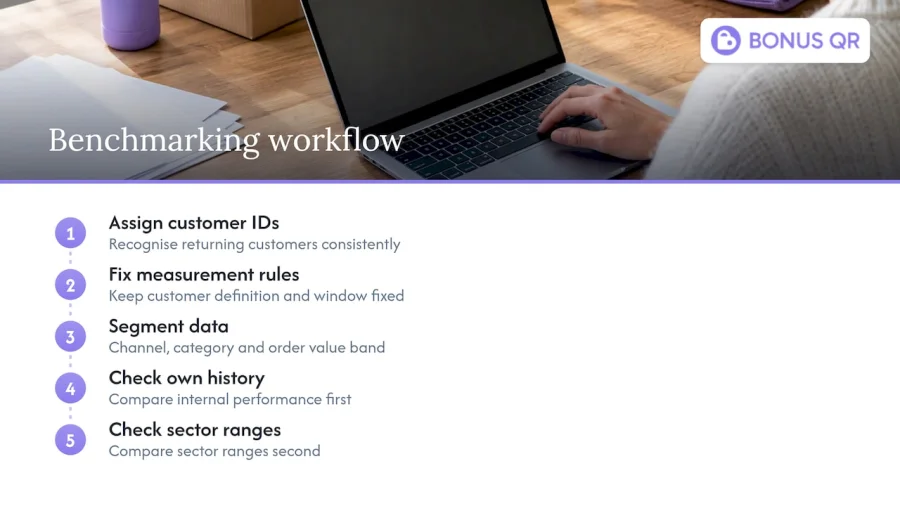
Reliable benchmarking starts with clean, consistent data collection, not with finding the perfect external number to compare against. Every order needs a stable customer identifier, so returning customers are correctly recognised rather than counted as new ones because they checked out as a guest or used a different email.
Decide your measurement window and customer definition before you pull a single report, then keep both fixed across every reporting period. Switching between 30 day and 365 day windows month to month, or redefining who counts as a “customer” partway through the year, makes trend lines meaningless even if each individual number is technically correct.
Segment your raw data by acquisition channel, product category and order value band from the start, since reconstructing that detail retroactively is far harder than tracking it from day one. Most ecommerce platforms and loyalty systems can export this data on a schedule, so set up a recurring report rather than pulling figures manually each time.
Once your internal numbers are consistent, benchmark them against your own historical performance first and sector ranges second. That order matters: your own trend tells you whether changes are working, while the sector range tells you only whether you are broadly in a reasonable position.
Role of digital loyalty programs in influencing repeat purchase rates with benchmarks
Digital loyalty programmes exist specifically to push repeat purchase rate above what it would be left to its own devices. Points, stamp cards and cashback rewards all give customers a concrete reason to come back rather than relying on brand affinity alone.
The mechanism is straightforward: a visible reward balance or a stamp card nearing completion creates a reason to choose your business again rather than a competitor, especially for categories where products are otherwise easy to substitute. This matters most in the mid-range product categories, apparel, cafes, salons and general retail, where repeat rates sit in a moderate middle ground and a loyalty incentive has real room to move the number.
Businesses already converting well on consumables tend to see loyalty programmes reinforce an existing habit rather than create one from scratch, while categories with naturally low repeat rates, such as big-ticket electronics, see loyalty programmes work more on referral and advocacy than on short-cycle repurchase. Either way, a loyalty programme functions as one of the more direct levers available for moving your own repeat purchase rate toward the stronger end of your sector’s benchmark range, rather than leaving it to organic behaviour alone.
Author perspective and practical takeaways
Repeat purchase rate deserves more attention than it gets, because it is one of the few metrics that predicts revenue stability rather than just revenue size. The mistake we see most often is businesses chasing a single industry number instead of their own trend. A rate that is improving matters more than a rate that merely looks respectable on paper.
— Michal
How BonusQR helps you turn benchmarks into repeat purchases
Knowing your benchmark is only useful once you can act on it, and that is where a loyalty platform earns its place. We built our loyalty platform around modules that directly influence repeat purchase rate: digital stamp cards, points collection, tiered cashback and automated reminders that bring customers back without requiring manual follow-up or POS integration.
Cafes, salons, gyms and retailers tend to see the clearest results because their customers already buy on a repeat cycle, and our job is simply to make that cycle visible and rewarding through the app. For businesses wanting their own branded experience, we offer a white-label setup at 690 EUR one-off plus a Monthly Subscription, and for larger operations with specific requirements, our Custom App Development starts from 1500 EUR one-off with Monthly Maintenance from 69 EUR per month.
If you want to see where your business fits first, our Free, Basic and Premium plans are a straightforward place to start, with Basic from 19 EUR per month and Premium from 69 EUR per month.
FAQ
What is a good repeat purchase rate?
A good repeat purchase rate depends heavily on what you sell: consumables often reach around 15% within 60 days, while durable goods sit closer to 10% within 365 days, according to standard metric guidance. The most useful benchmark is your own improving trend, measured consistently against the right window for your product type.
How do you calculate the repeat purchase rate?
Divide your number of repeat customers by your total number of customers, then multiply by 100 to get a percentage.
How do you calculate the repeat rate specifically?
The repeat rate uses the same formula as repeat purchase rate: repeat customers divided by total customers, multiplied by 100. The key is fixing your measurement window, typically 30, 90 or 365 days, and keeping it consistent across every reporting period.
What is the 80/20 rule in ecommerce?
The Pareto principle suggests that a small share of your customers, often loyal repeat buyers, tend to generate a disproportionately large share of total revenue. It is a reminder that strengthening repeat purchase behaviour among existing customers can matter as much as acquiring new ones.