Most advice about metrics for customer loyalty starts with the easiest number to report: programme sign-ups. That's also the number most likely to mislead a café owner, salon manager, gym operator, or independent retailer. A customer who joins once, never scans again, and ignores every reward hasn't demonstrated loyalty. They've only created a record.
Useful measurement follows behaviour. It shows whether customers return, redeem, spend, recommend, and remain satisfied. It also separates repeat buying caused by a convenient location or a low price from loyalty strong enough to survive a competitor's offer. UK participation is already high, so the commercial opportunity lies in turning passive memberships into active relationships, then connecting those relationships to profitable visits.
Why Sign-Up Counts Are Not Loyalty Metrics
A large membership list looks impressive on a dashboard, but it doesn't pay the till. UK shoppers belong to many schemes, and the gap between joining and using them is substantial. Independent UK market reporting says 55% of consumers belong to at least four loyalty schemes, while 58% have actively used three or fewer in the past six months. That contrast makes the problem clear: enrolment records interest, not loyalty. (Mintel's UK customer loyalty market reporting)
The grocery market makes the same point from another angle. Government data found that 97% of shoppers were members of at least one supermarket loyalty scheme, with shoppers holding an average of 3 memberships. Loyalty-priced products generated over £5 billion in revenue from November 2023 to January 2024, representing about 22% of total grocery revenue for supermarkets offering those promotions. (UK government grocery loyalty pricing review)
Those figures don't mean every enrolled customer is actively engaged. They show that membership is common and that real value appears when customers use the scheme during purchases. A café with 2,000 registrations can be commercially weaker than a café with 400 members who visit, scan, and redeem regularly. The smaller group creates cleaner behavioural signals and may produce more repeat revenue.
The numbers that deserve less attention
Sign-ups still have a role. They measure reach and tell staff whether the invitation to join is working. They become a vanity metric when management celebrates them without asking what happens afterwards.
A practical dashboard should distinguish:
- New registrations, which show acquisition into the programme.
- Activated members, who complete a meaningful next action, such as scanning during a visit.
- Active usage rate, the share of members who use the programme during a defined period.
- Redemption rate, the share of earned rewards that customers claim.
- Repeat purchase frequency, which connects participation to visits.
- Revenue per active member, which shows commercial value rather than database size.
Practical rule: A sign-up is an invitation accepted. A repeat visit is evidence that the invitation worked.
The first baseline should be captured before a new campaign changes customer behaviour. Count active members, visits, redemptions, average purchase value, retention, and churn. Review those measures over consistent periods, because one busy holiday week can make a weak programme look healthy.
The operator's question should therefore change from “How many members joined?” to “How many members returned, and what did they do when they came back?” That question keeps loyalty measurement tied to behaviour and revenue.
Core Financial Metrics Every Business Must Track
Financial metrics translate customer activity into decisions. A café can use them to judge whether a stamp reward is profitable. A salon can compare regular appointment retention with the cost of a win-back offer. A gym can see whether member engagement supports longer relationships rather than merely producing initial registrations.
Repeat purchase rate
Repeat purchase rate shows the proportion of customers who buy again during a chosen period.
Formula:
Customers who purchased more than once ÷ total customers × 100
For a café, if 120 customers visited during a measurement period and 48 returned for another purchase, the repeat purchase rate is:
48 ÷ 120 × 100 = 40%
The exact period should match the buying cycle. A coffee shop might review visits frequently, while a salon may need a longer window between appointments. The important discipline is consistency. A rising rate usually indicates that customers are returning, but it doesn't prove that they're emotionally attached to the brand. Price, proximity, and habit can all create repeat buying.
Retention rate
Retention measures how many existing customers remain active at the end of a period, excluding newly acquired customers.
Formula:
(Customers at end of period minus new customers acquired) ÷ customers at start of period × 100
Suppose a salon starts with 200 customers, ends with 180, and gains 30 new customers. The calculation is:
(180 minus 30) ÷ 200 × 100 = 75%
Retention answers a different question from repeat purchase rate. Repeat purchase rate focuses on customers buying again. Retention focuses on the customer base that stayed. A business can have strong new-customer activity and still lose too many established customers.
Churn rate
Churn is the share of customers who stop buying or cancel during the measurement period.
Formula:
Customers lost during period ÷ customers at start of period × 100
If a gym begins with 200 members and loses 20, churn is:
20 ÷ 200 × 100 = 10%
Retention and churn should be viewed together, not as competing headline figures. A rising churn rate deserves investigation by customer segment, location, acquisition source, and last visit. A single overall figure can hide the fact that new customers are staying while long-term regulars are leaving.
Customer lifetime value
Customer lifetime value, or CLV, estimates the value generated by a customer relationship. UK loyalty guidance defines the core calculation as average purchase value multiplied by purchase frequency and expected retention period, then adjusted for gross margin and discount rate. (UK loyalty ROI and CLV guidance)
A simplified illustration uses an average purchase of £8, a frequency of 3 purchases per month, and an expected relationship lasting 12 months:
£8 × 3 × 12 = £288 revenue CLV
That is revenue, not profit. The operator should adjust it for gross margin and the cost of rewards before making a budget decision. A useful resource for operators building a more detailed model is this guide to CLV for coffee shops.
Core Loyalty Metrics at a Glance
| Metric | Formula | Example | What It Tells You |
|---|---|---|---|
| Repeat purchase rate | Repeat customers ÷ total customers × 100 | 48 ÷ 120 = 40% | Whether customers come back |
| Retention rate | (End customers minus new customers) ÷ start customers × 100 | (180 minus 30) ÷ 200 = 75% | How much of the existing base remains |
| Churn rate | Customers lost ÷ start customers × 100 | 20 ÷ 200 = 10% | How quickly customers are leaving |
| CLV | Average purchase value × frequency × retention period | £8 × 3 × 12 = £288 | The revenue potential of the relationship |
These measures interlock. Higher visit frequency can raise CLV, while stronger retention gives the relationship more time to generate value. The spreadsheet doesn't need to be complex. It needs a stable customer identifier, reliable visit records, reward costs, and a review routine.
Behavioural and Satisfaction Metrics Most Businesses Miss
Revenue metrics tell the operator what happened. Behavioural and satisfaction measures help explain why it happened. Without both, a business may see falling visits but miss the service issue, product problem, or reward design flaw behind the decline.
UK brands show a clear imbalance. Collinson's 2025 UK loyalty study found that around two-thirds of brands tracked spend-based KPIs, while 56% tracked retention, 49% tracked engagement, and only 38% tracked satisfaction. (Collinson's 2025 UK loyalty landscape) A balanced scorecard should not let sales data drown out customer experience.
Behaviour shows commitment
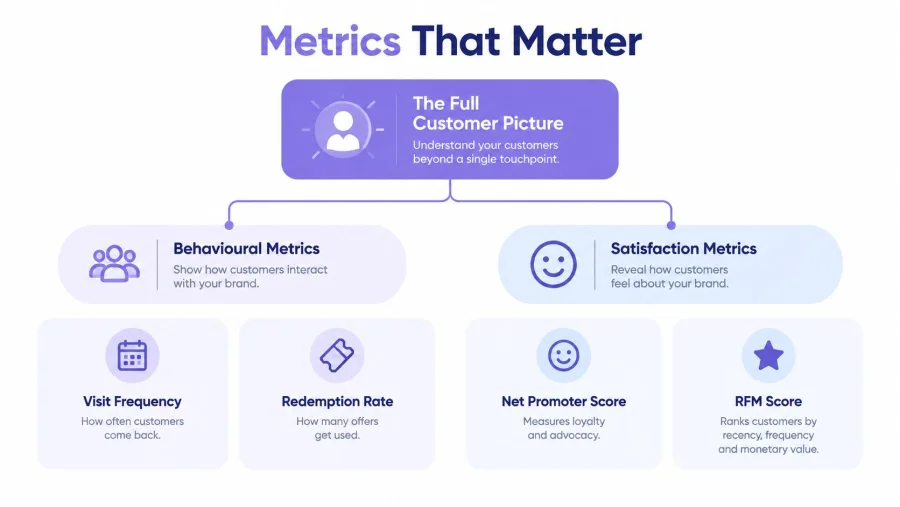
Visit frequency is often more useful than total revenue for a local business. A customer who visits regularly but spends modestly may be more valuable over time than a high-spending customer who appears once. Review average visits by customer, then compare members who redeem rewards with members who never do.
Redemption rate tests whether the reward has a reason to exist.
Rewards redeemed ÷ rewards earned × 100
High redemption usually indicates that customers understand the offer and see value in it. Low redemption can signal confusing rules, an unattractive reward, a difficult claiming process, or insufficient reminders. It can also expose a margin problem. A reward may be popular but unprofitable, so redemption must sit beside CLV and gross margin.
Active usage rate separates members who performed a meaningful action from those who remain registered. Define “active” before reporting it, such as a member who scanned, earned, redeemed, or purchased during the review window. Changing the definition later makes trend comparisons unreliable.
Satisfaction reveals the reason
Net Promoter Score asks whether a customer would recommend the business. It can help identify advocates and detractors, but it should be paired with a short reason question. A positive score without a reason doesn't tell the operator whether customers value speed, friendliness, product quality, convenience, or price.
RFM segmentation combines recency, frequency, and monetary value. It works well for small businesses because it turns a long customer list into practical groups:
- VIP customers visit recently, visit often, and spend strongly. Thank them, offer early access, and ask for reviews or referrals.
- At-risk regulars used to visit frequently but haven't returned recently. Send a relevant reminder or a modest recovery offer.
- Dormant members have old or limited activity. Test a reactivation message, then stop spending on customers who remain unresponsive.
- New customers have recent activity but little history. Give them a clear reason to make the next visit.
A useful scorecard therefore combines financial outcomes, observed behaviour, and customer sentiment. No single number can distinguish a loyal advocate from someone returning only because a discount is cheaper.
How to Capture Loyalty Data Without POS Integration
Small businesses often assume serious loyalty measurement requires a POS connection, specialist hardware, or a developer. That assumption creates unnecessary delay. A QR-based process can record the essential events with a printed code, a staff smartphone, and a customer's own phone.
A simple scan workflow
- The customer joins by scanning a QR code on the counter, table, receipt, membership card, or menu.
- The customer receives a profile with a personal QR code or digital pass.
- Staff scan at the visit, recording the event without changing the till.
- The system records the reward event, such as a stamp, point, cashback amount, visit threshold, or spend threshold.
- The customer redeems in the same flow, while the platform records the redemption separately from the earning event.
- The operator reviews trends, including visits, returning customers, reward use, customer profiles, and campaign response.
A platform such as coffee shop mobile loyalty can support this model without requiring POS integration. The key is not the QR code itself. The key is giving every customer a consistent identifier so the business can connect visits over time.
Accuracy depends on operating habits
Staff need one clear instruction: scan every eligible visit before completing the interaction. The process should take seconds, work on familiar phones, and include a simple recovery method for a missed scan. A complicated loyalty routine gets skipped during the morning rush.
Customer friction also affects data quality. Registration should ask only for information the business can use, such as contact details needed for rewards and permission for relevant communications. A short feedback form can help test satisfaction, while broader market research can be supported with practical questionnaires from Business Loan Warrior.
QR tracking won't automatically capture every pound spent unless staff record spend or the customer's purchase is connected through another method. That limitation should be stated clearly. Even without transaction-level integration, visit frequency, redemption, active usage, retention, and campaign response can provide a useful operating view.
The strongest setup combines visible QR prompts, staff training, consistent reward rules, and a weekly review. Enterprise-style measurement becomes accessible when the business focuses on reliable events rather than expensive infrastructure.
UK Benchmarks and What Your Numbers Should Look Like
Benchmarks are useful only when they answer a management question. A café shouldn't chase a percentage just because another business reports it. The operator should ask whether the current figure is improving, whether the reward cost is justified, and whether the metric matches the normal buying cycle.
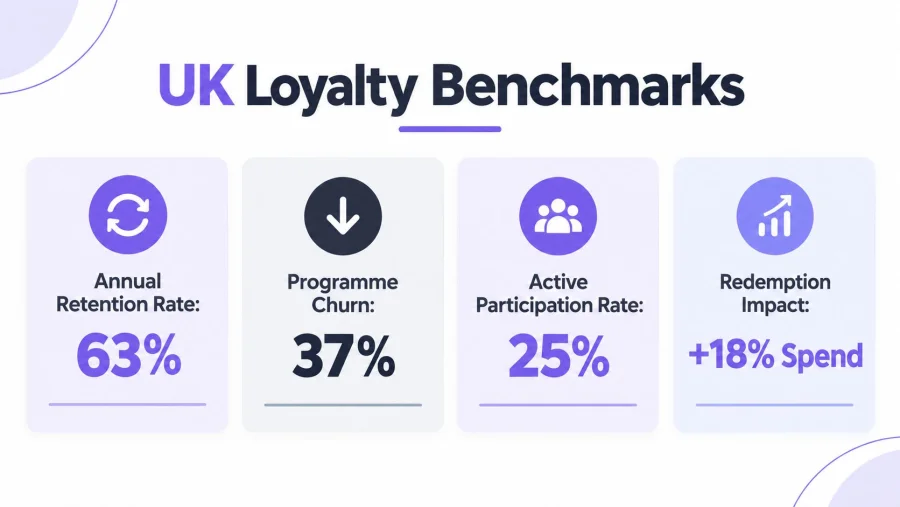
UK brick-and-mortar retail benchmarks indicate annual retention of about 63% and churn of 37%. The same benchmark identifies geographic convenience and localised loyalty as major retention drivers, which supports location-sensitive offers, visit-triggered rewards, and store-level segmentation over generic discounts. (UK retail retention benchmark)
How to interpret the comparison
A business above that retention benchmark may have a strong local habit, effective service, or well-designed customer communication. It should still check profitability, because retention bought through excessive discounting can weaken margin. A business below it should examine when customers disappear, not immediately launch a bigger reward.
Participation needs even more caution. UK grocery data shows 97% of shoppers belong to at least one supermarket loyalty scheme and shoppers average 3 memberships. (UK supermarket loyalty participation data) That near-universal participation means a new programme can't rely on novelty alone. It has to make earning and redeeming simple.
Redemption provides a stronger engagement signal than membership. UK consumer research reported that loyalty redeemers recorded a 71.3% increase in purchases per customer versus non-redeemers over 90 days. (UK loyalty redemption research) The figure is a benchmark, not a promise for every café or salon. It does support tracking redeemers separately from non-redeemers and testing whether the difference persists after accounting for existing customer activity.
Self-reported loyalty also moves over time. The SAP/Emarsys Customer Loyalty Index recorded UK loyalty at 55% in 2021, 73% in 2022, 64% in 2023, and 67% in 2024, a movement of nearly 20 percentage points across a short period. The same index reported that 71% of consumers are more loyal when brands offer discounts, incentives, rewards, and personalised service. (SAP/Emarsys Customer Loyalty Index 2024)
Price pressure makes this especially important. EY reported in 2025 that UK consumers were prioritising value over brand loyalty, while SAP coverage found 64% said they were loyal to products rather than brands and 43% of Gen Z bought items because they were trending on social media. (EY UK brand loyalty report) Repeat buying should therefore be paired with advocacy and satisfaction rather than treated as proof of emotional loyalty.
Turning Metrics Into Action That Drives Repeat Visits
A dashboard only earns its place when a number triggers a decision. Each metric should have an owner, a review rhythm, and a planned response. Otherwise, staff collect data that never changes the customer experience.
| Signal | Likely issue | Practical response |
|---|---|---|
| Churn rises | Customers are disappearing after a visit or membership period | Segment by last visit and send a relevant win-back message |
| Redemption stays low | Customers don't understand or value the reward | Simplify the rule, shorten the path to value, and explain the reward at checkout |
| Visit frequency flattens | The programme isn't creating a reason to return | Use visit-triggered reminders, seasonal offers, or a next-visit incentive |
| CLV falls | Discounts or low frequency are reducing relationship value | Review margin, reward cost, purchase frequency, and customer mix |
| Satisfaction drops | Service or product experience may be weakening | Ask a short follow-up question and fix the most common operational cause |
Build campaigns around customer groups
RFM segments make the action more precise. A VIP customer doesn't need the same discount as a dormant account. A VIP may respond better to recognition, early access, or a birthday benefit, while a dormant member may need a clear, time-limited reason to return.
For at-risk regulars, the campaign should refer to the customer's previous behaviour without making the message intrusive. The business can test a personal reminder, a product-related suggestion, or a reward tied to the next visit. If the customer returns, the programme records the recovery. If not, the operator can stop repeatedly discounting an unresponsive profile.
Gym operators face a different purchase rhythm from cafés, so their dashboard should emphasise attendance, renewal, and cancellation signals. Guidance on retention metrics for gym owners can help fitness businesses adapt the same measurement discipline to memberships rather than daily transactions.
Close the measurement loop
A campaign should have a before-and-after comparison. Record the target segment's visit frequency, redemption, average purchase value, and margin contribution before launch. After the campaign, compare those measures with a similar group that didn't receive the offer where practical.
The right question isn't “Did the coupon get used?” It is “Did the coupon create profitable additional behaviour?” A redemption that replaces a full-price purchase may be less valuable than an unredeemed message that reminds a customer to visit at a normally quiet time. For cafés considering a practical setup, BonusQR loyalty for cafes provides a QR-based campaign route that can connect offers with visit activity.
Start Measuring What Matters with BonusQR
SMBs don't need to wait for a POS project before measuring loyalty. A QR-based programme can capture customer profiles, visits, reward earning, redemptions, and campaign responses through a customer's phone and a staff scan. The useful output is a live view of active members, returning customers, visit trends, coupon performance, and the relationship between engagement and value.
BonusQR is one option for this operating model. It supports stamps, points, cashback, visit and spend thresholds, fixed discounts, welcome bonuses, birthday offers, seasonal coupons, and automated push or email campaigns. Businesses can start on a free tier, launch an affordable white-label app under their own icon in about 14 days, or commission a custom app with advanced integrations.
The sensible starting point is small. Define active usage, record a baseline, train staff to scan consistently, and review the first week of data. Start with BonusQR for free and use the first week to identify who returns, who redeems, and which offer gives customers a reason to come back.


