61% of UK shoppers say loyalty schemes influence where they shop, and 39% are more likely to choose a retailer with a strong loyalty offer, according to the British Retail Consortium's 2024 findings cited in the brief. That should change how any owner reads a loyalty dashboard. In a market where so many customers already respond to loyalty, sign-ups alone are no longer proof of value, they're just the starting line for measuring whether the programme changes behaviour.
The sharper question is whether members come back, how often they spend, and whether rewards cause a real shift in habit. That matters even more because the UK market already has deep loyalty participation, so a big enrolment number can look impressive while hiding weak repeat custom. For cafés, restaurants, salons, gyms, and retail stores, loyalty program KPIs should show whether the programme is pulling people back within 30, 60, or 90 days, not just whether they tapped “join”.
Why loyalty Kpis matter more than sign-ups in the UK
A loyalty programme can look healthy on paper and still fail in the till. That's the problem with celebrating enrolment first, because in the UK, loyalty is already part of normal shopping behaviour. The British Retail Consortium reported that 61% of UK shoppers said loyalty schemes influence where they shop, and 39% said they're more likely to choose a retailer with a strong loyalty offer, which means customers are already conditioned to respond to rewards rather than merely notice them.
At the same time, consumer enrolment is already widespread, with about 65% of people enrolled in at least one loyalty scheme, according to the verified data. In that kind of market, a big member count doesn't differentiate a business. It only shows that the entry gate worked.
What matters is whether the programme changes how people behave after they join. A café owner cares less about raw sign-ups than about whether a new member returns on a routine, a salon cares whether a client rebooks inside a sensible cycle, and a gym cares whether members stay active instead of drifting away. Those are the signals that show whether loyalty is becoming habit.
Repeat custom is the real test
The clearest UK KPI is repeat custom. That's because retail, hospitality, and personal care businesses live or die on return visits, and the verified data ties loyalty participation directly to store choice and repeat purchasing behaviour. The practical question isn't “How many joined?” It's “How many came back within 30, 60, or 90 days?”
Practical rule: If sign-ups are rising but repeat visits aren't, the programme is adding admin, not revenue.
That's why owners should read loyalty data through a margin lens. A spreadsheet full of enrolments can flatter a campaign. A chart showing repeat visits, retention, and spend per visit tells the truth about whether the rewards are doing real work in a high-cost market.
The five vital signs of a healthy loyalty programme
A useful loyalty dashboard works like a car's instrument panel. The driver does not need to understand engine design to know when something is wrong, they just need the right gauges. The same is true for loyalty program KPIs. Five vital signs cover most of what a small business needs to know before adding anything fancy.
1. Repeat visit rate
This shows whether members are coming back. If a programme attracts sign-ups but does not change return behaviour, the offer is too weak, too slow, or too hard to understand. For businesses that depend on footfall, this is usually the first number to watch.
2. Purchase frequency
Frequency tells you how often members buy in a set period. A coffee shop with low frequency has a different problem from a salon with long cycles, but in both cases the KPI shows whether loyalty is shifting routine. If frequency rises, the programme is working at the habit level.
3. Customer lifetime value
CLV matters because it connects loyalty to the money side of the business. It shows whether the member relationship is worth more over time after reward costs are accounted for. A programme that grows CLV deserves attention. One that grows membership but not CLV deserves scepticism.
4. Redemption rate
Redemption tells you whether rewards are being used. Low redemption often means the offer is confusing, too delayed, or not meaningful enough. Very high redemption can also be a warning if the economics are too generous, because rewards can become a subsidy instead of a behaviour driver.
5. Active member rate
This is the clearest way to see whether members are still active in the programme. If people joined months ago and have not transacted recently, the programme may be filling a database without creating commercial movement. Active members are the pool that matters.
As the BRC data shows, loyalty is already mainstream in the UK, so the job is not to get people to join. It is to tell whether the programme is changing what they do next.
The fastest way to review these five together is to keep them on one screen and avoid overcomplicating the dashboard. For owner-operators who also need to manage local marketing spend, a practical guide like small business marketing budget tips can help keep loyalty activity grounded in what the business can sustain.
Measuring customer loyalty metrics works best when the numbers are tied to one decision each. If repeat visits are weak, the offer needs work. If redemption is low, the reward may be too distant or too hard to use. If active members are drifting down, the programme is losing relevance and needs a clearer reason to return.
How to calculate the essential loyalty metrics
The formulas don't need to be academic. They need to answer one simple question, is the programme changing customer behaviour or just recording it? The cleanest way to use loyalty program KPIs is to define each one in plain language, calculate it consistently, and attach one operational decision to it.
Repeat visit rate and purchase frequency
Repeat visit rate can be calculated as the number of members who return within a chosen window, divided by total members in that period. If 40 members join and 10 return inside 30 days, the repeat visit rate is 10 out of 40. The interpretation is straightforward, the window is too weak if returns are rare, or the offer is too slow to create momentum.
Purchase frequency is the average number of transactions per member per month. If a member base generates 200 transactions across 50 active members, the frequency is 4 transactions per member for that month. If frequency stays flat while enrolment rises, the programme is collecting names rather than changing habit.
CLV, redemption rate, and active member rate
Customer lifetime value should be margin-adjusted, not just revenue-based. A simple version is total revenue from a member over time, minus reward cost, communication cost, and technology cost, with the result viewed against the member's tenure. That keeps the business honest about whether the relationship is profitable.
Redemption rate is rewards claimed divided by rewards issued. If 80 rewards go out and 20 are claimed, the rate is 20%. That doesn't automatically mean success or failure, it means the reward design needs a closer look.
Active member rate is members who transacted in the last 30 days divided by total members. If 300 people are in the programme and 90 bought in the last month, the rate is 30%. A falling active rate usually deserves attention before the next campaign goes out.
For a practical benchmark mindset, the measuring customer loyalty metrics article is useful as a companion because it keeps retention thinking close to business decisions rather than vanity counts. For teams that want a deeper merchant-facing reference, Loyaltie merchant guides can also help frame reward mechanics in operational terms.
Measure the same definition every week. If the formula keeps changing, the trend line stops meaning anything.
UK benchmarks by sector and what to expect
A universal target is a trap. A café, a salon, and a gym don't run on the same purchase rhythm, so loyalty program KPIs should be set by sector economics, not by one generic benchmark. The right question is not “What's a good number?” It's “What behaviour should change in this category, and how quickly?”
| Sector | Best metric to prioritise | Typical healthy range |
|---|---|---|
| Cafés and quick-service eateries | Repeat visit rate and purchase frequency | Frequent return behaviour and steady redemptions that fit short purchase cycles |
| Restaurants and pubs | Repeat visit rate and incremental spend | Returning guests plus stronger basket value from loyalty members |
| Salons and wellness centres | 60-day and 90-day repeat rate | Rebooking inside the service cycle, not just immediate returns |
| Gyms and fitness studios | Active member rate and cancellation prevention | Members staying engaged rather than going dormant |
| Retail and grocery stores | Repeat custom and basket value | Consistent repeat purchase behaviour with meaningful spend per visit |
Cafés and quick-service sites usually need low-friction rewards, because the transaction size is small and the visit cycle is short. A stamp, a free item, or a simple threshold can be enough to lift frequency if it's easy to understand at the counter. The KPI that matters here is whether members come back more often, not whether they accumulate points for the sake of it.
Restaurants and pubs have a different problem. They need to watch repeat behaviour and average spend together, because a programme that drives more visits but lowers margin can still fail. Salons and wellness businesses should give more weight to longer repeat windows, since the purchase cycle stretches naturally beyond weekly habits.
Retail and fitness need different reads
Retail and grocery businesses sit between frequency and basket size, so they need a cleaner view of both. Retail loyalty solutions are most useful when they track repeat behaviour alongside purchase value, not just membership growth. Gyms and fitness studios need to pay special attention to active retention, because a dormant member is often the first sign of cancellation risk.
The safest way to set targets is to start with the behaviour the category already encourages, then ask whether loyalty makes that behaviour more valuable. That keeps the KPI tied to the business model instead of to a spreadsheet benchmark copied from somewhere else.
Proving your programme moves behaviour, not just points
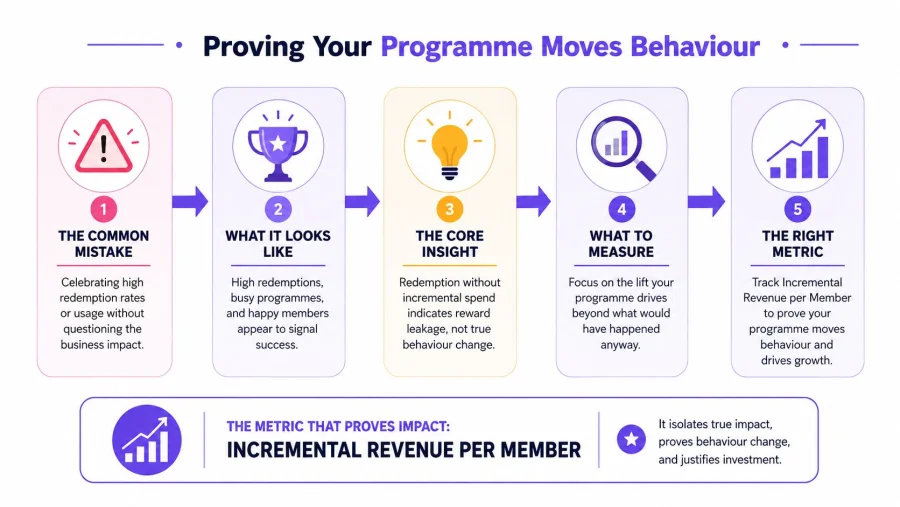
High redemption is not automatically good. A programme can show strong reward usage and still fail to create any extra demand if people would have bought anyway. The test is incremental lift, because the KPI that matters is the difference between members and a comparable non-member group, not raw repeat activity alone.
Start with a control group
A basic holdout test is simple. Keep a small group of new enrollees on the same programme structure but track them separately, or compare members against a matched non-member cohort with similar buying patterns. Then watch repeat purchase rate, spend per visit, and margin-adjusted CLV.
That is where many dashboards fall apart. They count activity inside the programme but never ask what would have happened without it. If the member and non-member lines behave the same, the programme is mostly confirming existing intent.
Read the economics, not just the usage
Redemption can be a good sign only when it leads to incremental behaviour. If rewards are claimed without any meaningful change in frequency or spend, the business may just be subsidising normal demand. That's why the best KPI stack combines visit frequency lift, check-size differential, and active-member rate together.
Practical rule: A reward that lifts visits but compresses margin may still lower total profit.
That trade-off matters in the UK because cost pressure hasn't gone away. The British Retail Consortium reported shop prices were still 0.7% higher year-on-year in June 2026, with food prices up 4.3%, so margin protection remains a live issue for retailers and food-led businesses. In that environment, a loyalty programme has to earn its keep in profit terms, not just in activity.
Collecting and visualising data with BonusQR analytics
A lot of loyalty reporting breaks because the data lives in too many places. Receipts sit in one system, redemptions in another, and member notes are buried in spreadsheets. A cleaner setup is to collect member activity, visit history, and reward use in one dashboard, then review the numbers on a fixed rhythm.
What to visualise first
Start with monthly cohorts rather than rolling averages. Cohorts make it easier to see whether newer members behave differently from older ones, and they stop one strong week from hiding a weak month. The first charts should show joins, returning customers, redemptions, and active members over time.
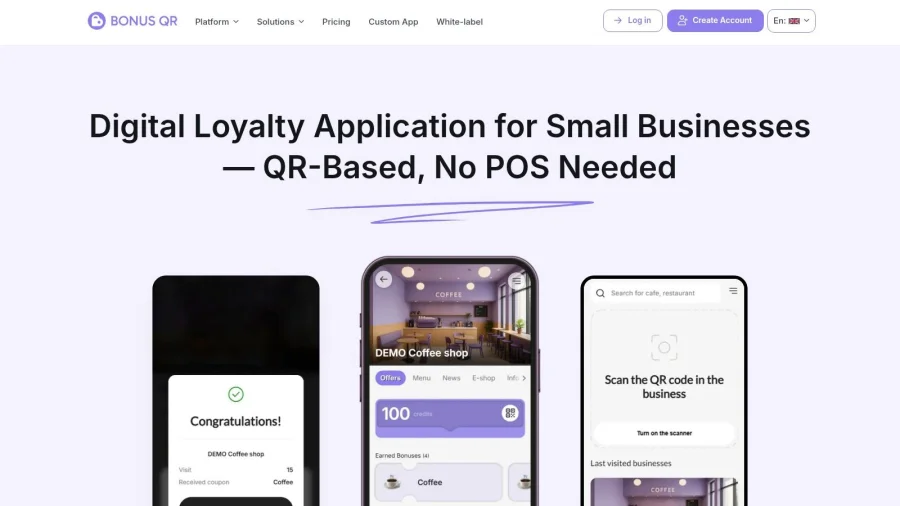
The product's built-in analytics can reveal top customers, coupon performance, and visit trends, while automated push and email campaigns drive timely offers and feedback requests. That matters because a loyalty programme should not only report behaviour, it should trigger the next action. If a member goes quiet, the system should make that obvious.
Keep the reporting light
For brick-and-mortar businesses, the attraction is low friction. BonusQR can be used without POS integration or extra hardware, which means the team doesn't need a separate IT project just to start reading programme performance. That makes it easier to review track customer loyalty data without delaying the business for months.
The most useful visual checks are simple ones. Look for drops in active members, changes in reward usage, and whether specific coupons keep getting ignored. Export the report weekly, keep it short, and hand the numbers to the person who can act on them quickly, usually the owner or the shift lead.
Your weekly loyalty reporting checklist
A weekly review only works if it stays short enough to repeat. The point is catching drift before it turns into lost visits. A good loyalty program KPIs checklist has five rows and one decision attached to each row.
The one-page template
| Metric | Trend | Next action |
|---|---|---|
| Enrollment | Up, down, or flat | Check whether sign-up prompts are working |
| Active rate | Up, down, or flat | Look for dormant members and send a reactivation offer |
| Redemption rate | Up, down, or flat | Confirm the reward is clear and worth claiming |
| Average reward value | Up, down, or flat | Test whether the offer is too generous or too weak |
| Member growth | Up, down, or flat | Compare new members with returning members |
A useful weekly routine is to pull the same report every seven days, then ask three questions. Which metric moved, which one stayed stuck, and which one needs a human response before the next shift? That keeps the review tied to action, not observation. It also makes weak trends easier to spot before they become normal.
Owner's rule: If a metric changes but nobody changes anything, the KPI wasn't being managed.
What to do next
First, audit the current dashboard against the five vital signs. If one of them is missing, the programme is probably over-reporting membership and under-reporting behaviour. Second, set up a holdout test or a baseline comparison if there isn't one already. That gives you a simple way to separate real incremental behaviour from repeat visits that were likely to happen anyway.
Third, build a recurring seven-minute review habit using the analytics already available, so the team sees the same truth each week. Keep the checklist visible, keep the actions specific, and treat every flat line as a question, not a result. If a metric has been flat for two weeks, run a holdout test on the next reward offer and see whether the change moves visits.


