A café owner can recognise regular customers by face, remember their usual order and still have no reliable answer to a basic business question: which customers are most likely to return next week? A drawer full of punch cards records activity, but it rarely explains what caused a visit, which offer worked or when a valuable customer started drifting away.
That gap between collecting loyalty data and using it to make a decision is where many brick-and-mortar businesses lose opportunity. Loyalty data analytics turns visits, purchases, redemptions and responses into practical signals, so owners can replace guesswork with more relevant offers, better follow-up and clearer decisions about retention.
Why Brick-and-Mortar Businesses Miss the Loyalty Data Opportunity
A familiar face isn't the same as usable customer knowledge. Staff may know that someone visits often, yet the business might not know whether that customer responds to discounts, prefers particular products or has recently reduced visit frequency. Without a consistent record, each interaction stays isolated.
Loyalty data analytics connects those interactions. It gathers customer behaviour from a loyalty programme, organises it and shows patterns that can guide marketing, service and operational choices. The value isn't limited to identifying the biggest spender. A useful system can also reveal regular low-value visits, occasional high-value purchases, dormant members and customers who respond only to specific incentives.
The familiar programme problem
Traditional punch cards have a place. They're easy to explain and can encourage a customer to return for a reward. They don't, however, give an owner much visibility into wider behaviour. A paper card usually can't distinguish between a customer who visits every few days and one who returns only when a card is nearly complete.
Digital loyalty doesn't automatically solve that problem. A business can collect more information and still fail if nobody reviews it, defines useful segments or gives staff a clear next action. A dashboard that sits untouched is only a more attractive filing cabinet.
UK participation shows why a more thoughtful approach matters. The UK government's 2024 review of loyalty pricing in the groceries sector found that 97% of shoppers belonged to at least one supermarket loyalty scheme, and that shoppers belonged to an average of 3 schemes (UK government review of loyalty pricing). Customers already understand loyalty mechanics, so a generic points offer may not be enough to earn attention.
Data should change a decision
The practical test is simple: can the data tell the owner what to do differently today? For example, a café might send a welcome reward to new members, a reminder to customers whose visits have faded or a product suggestion to people who repeatedly buy a particular category.
Owners looking beyond customer behaviour may also benefit from a guide to analytics for retail inventory optimization, because loyalty patterns can inform stock decisions as well as promotional activity. The strongest programmes connect customer insight to a real workflow, rather than treating analytics as a report produced for its own sake.
Understanding the Core of Loyalty Data Analytics
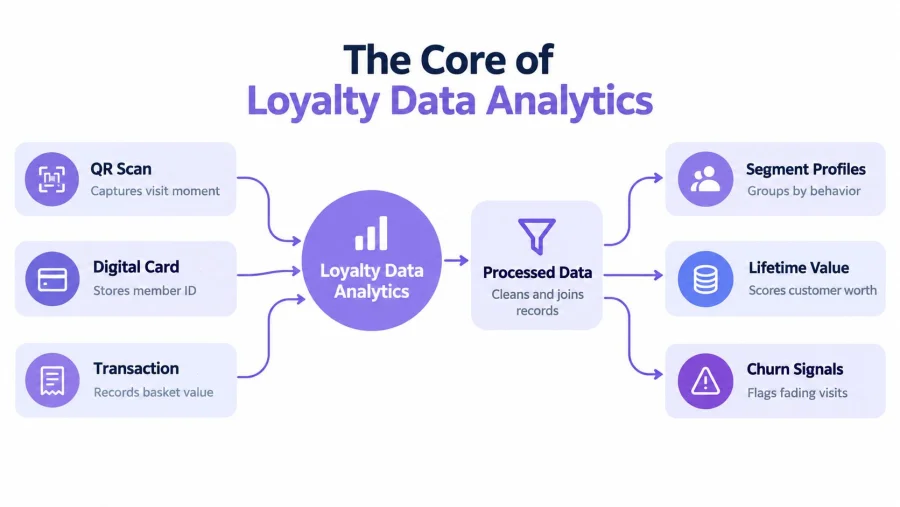
Loyalty data analytics follows a straightforward chain. A business captures a signal, connects it to a customer profile, interprets the behaviour and assigns an action. The sophistication comes from the quality of the process, not from using complicated terminology.
Start with reliable signals
A QR scan can capture the visit moment. A digital card can identify the member. A transaction can record basket value or product category. Each signal has limited value on its own, but together they create a more useful behavioural footprint.
The first operational question is not “What data can the business collect?” It's “What decision will this data support?” If the objective is to increase return visits, visit date, visit frequency and time since last activity matter. If the objective is to improve offer profitability, basket value, product mix and redemption behaviour deserve more attention.
The process usually has four stages:
- Capture: Record the visit, purchase, reward action or campaign response at the point where it happens.
- Clean: Remove duplicates, correct obvious errors and standardise customer and transaction fields.
- Join: Connect activity to the right member profile without creating multiple identities for the same person.
- Interpret: Turn the record into a segment, score or trigger that staff and marketing tools can use.
A small business doesn't need every possible field. It needs consistent fields that answer important commercial questions. A simple system used every day will usually outperform a complex system that staff avoid.
Move from totals to causes
A total member count tells an owner how many people have joined. It doesn't show whether membership changes purchasing behaviour. Better analysis compares groups and actions. Do members who received a welcome offer return more reliably than new members who received nothing? Do reward redeemers increase their visit activity, or do they just discount purchases that would have happened anyway?
That shift moves measurement beyond points tracking towards revenue contribution, repeat behaviour and campaign effectiveness. Businesses seeking more detail on how customer information can support repeat buying can review this practical resource on how to drive repeat purchases with data.
The BonusQR analytics dashboard is one example of a no-POS approach that brings member activity, reward actions and visit patterns into a more accessible view. The principle remains the same with any tool: an insight earns its place when someone can act on it without exporting a spreadsheet, interpreting obscure fields or waiting for technical help.
Key Metrics and KPIs to Track for Growth
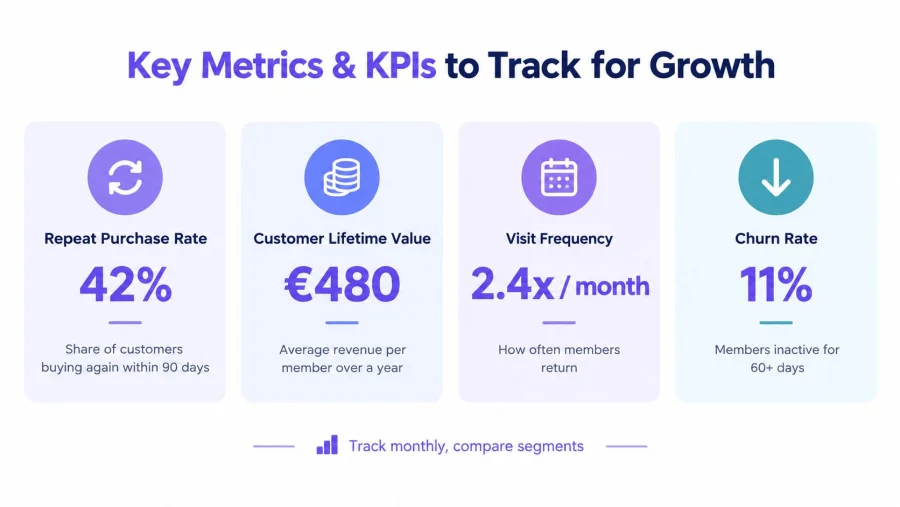
A loyalty dashboard can display many measurements, but a busy owner needs a short commercial scorecard. The right KPIs explain whether customers return, what they spend, how often they visit and whether marketing activity changes behaviour.
The retention measures
Repeat purchase rate shows the share of identified customers who buy again within a defined period. The period should match the business rhythm. A café may examine short return windows, while a salon or specialist retailer may need a longer interval. The definition matters more than choosing a fashionable benchmark.
Visit frequency shows how often active members return. It helps distinguish a large membership base from a genuinely engaged one. A falling frequency can indicate weaker relevance, inconvenient rewards or a service problem before total sales make the issue obvious.
Churn or inactivity identifies customers who have stopped visiting within a chosen window. It shouldn't be treated as proof that a customer is lost. It is a prompt for a measured reactivation test, particularly when the customer previously visited often or generated healthy margins.
The value measures
Average order value helps reveal whether loyalty activity supports profitable baskets or merely produces discounted transactions. Compare members and non-members carefully, then separate full-price purchases from reward-led purchases. A higher order value isn't automatically beneficial if the margin disappears through unnecessary incentives.
Customer lifetime value provides a longer view of customer worth. For a small business, a useful working estimate can combine purchase value, visit frequency, expected active period and gross margin. It doesn't need to be a perfect financial model. It needs to help the owner decide which customers deserve personal attention and which offers are too costly.
UK loyalty measurement is already moving beyond simple engagement counts. A UK retail loyalty benchmark reports that 63% of retail respondents had a data analytics and reporting tool configured with their programme, while another UK-focused benchmark found that around two-thirds of programmes tracked spend-based KPIs, 56% tracked retention and 49% tracked engagement (Collinson UK retail loyalty infographic). These measures point towards revenue contribution and repeat behaviour, not just enrolment.
The action measures
Redemption rate indicates whether customers understand and value the reward. A low rate can mean the reward is irrelevant, difficult to claim or too distant. A high rate can be positive, but the business should still check whether redemption produces an additional visit or merely reduces the price of an existing purchase.
Campaign response should include more than clicks or opens. Track visits, purchases, redemptions and margin after the campaign, then compare results with a similar group that didn't receive the offer where practical. This is the difference between activity reporting and commercial measurement.
The guide to customer retention metrics for small businesses can help owners turn these measurements into a manageable review routine. A monthly comparison by customer segment is more useful than a long list of figures nobody uses.
Data Sources and Implementation for Any Business Size
A modern POS system can make data collection easier, but it isn't a prerequisite. The best setup depends on how the business takes payment, how staff work and what customers will use.
| Setup | Useful signals | Main advantage | Main trade-off |
|---|---|---|---|
| Integrated POS loyalty | Purchases, products, spend and member identity | Rich transaction detail | Integration, cost and technical dependency |
| Digital card without POS connection | Visits, stamps, rewards and member activity | Quick launch with limited hardware | Less automatic product-level information |
| Manual staff-assisted tracking | Visits, redemptions and selected customer details | Works with simple operations | Requires consistent staff behaviour |
| Spreadsheet or exported records | Basic customer and transaction history | Flexible for early analysis | Identity errors and slow updates |
The integrated route suits retailers with structured product data and an established checkout workflow. It can support detailed analysis of category preferences, basket composition and offer profitability. It can also become expensive or disruptive if the POS requires custom development, staff retraining or multiple systems to communicate reliably.
A no-POS setup makes a different trade-off. It captures fewer transaction details, but it can remove the technical barrier that prevents a small café, salon or studio from starting. Staff can identify a member, record an eligible visit and redeem a reward without changing the payment process.
Choose the smallest useful system
Implementation should begin with one commercial objective. A café might focus on increasing visits from occasional customers. A salon may want to encourage the next booking. A retailer may want to identify customers who buy a category regularly but haven't returned recently.
The data collection method should then match that objective:
- For visit frequency: Capture member identity and visit date consistently.
- For reward effectiveness: Record the reward issued, redeemed and associated purchase.
- For reactivation: Track the last meaningful activity and the response to a reminder.
- For customer value: Combine purchase or spend information with visit behaviour where available.
BonusQR offers QR-based stamps, points, cashback, visit and spend thresholds, discounts, welcome bonuses, birthday and seasonal coupons, alongside member profiles, reward history, visit information and reporting. It doesn't require POS integration or extra hardware, so it represents one practical option for a brick-and-mortar business that needs a lower-complexity starting point.
Make adoption part of the design
The customer journey should take seconds, not a lengthy registration conversation. Staff need one clear instruction, such as asking whether the customer wants the visit added to the loyalty account, then scanning or redeeming through the agreed process.
Owners should test the journey during a busy period, not only in a quiet planning session. If the process slows the queue, requires repeated passwords or leaves staff uncertain about reward rules, the data will become incomplete. A smaller programme with dependable participation will give better insight than a broad programme with inconsistent records.
Practical Use Cases From Segmentation to Churn Prevention
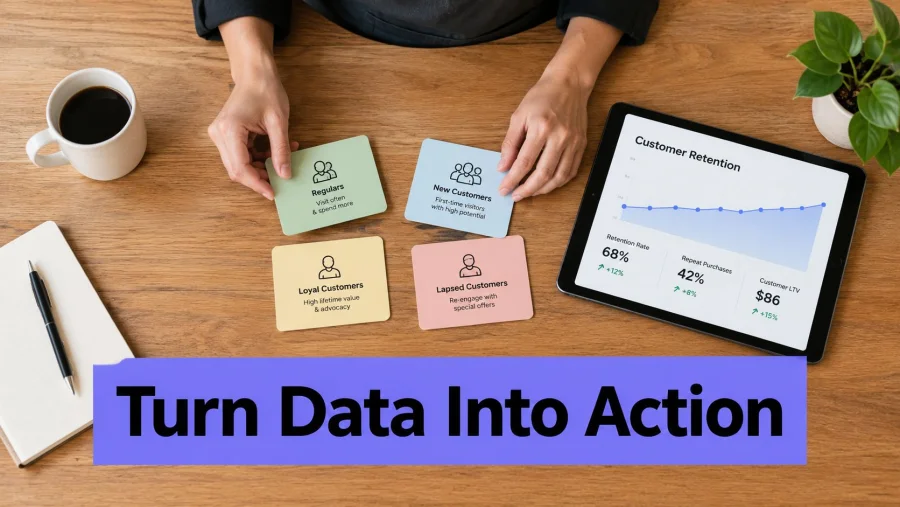
A coffee shop can start with a simple observation. Some members visit regularly, some joined recently and haven't returned, and others respond whenever a particular reward becomes available. Treating all three groups alike wastes the information the programme has collected.
Segment by behaviour, not just status
A useful café segmentation might include:
- Frequent regulars: Protect the relationship with recognition, early access or a relevant product suggestion rather than constant discounting.
- New members: Give a clear reason to make another visit while the first experience is still recent.
- Fading visitors: Send a timely reminder linked to a familiar purchase or occasion.
- Reward-focused members: Check whether offers create incremental visits or just subsidise existing behaviour.
The same logic applies in a salon. Customers who book reliably may need convenient rebooking prompts, while customers who cancel or leave long gaps may need a different message. A retail shop can identify customers who bought from one category and introduce a complementary item, but the recommendation should reflect actual purchase history rather than a generic catalogue blast.
Measure the action, not the intention
Suppose a café sends a return reminder to fading visitors. The owner should record who received it, who visited afterwards, what reward was used and whether the visit produced a normal basket. If every recipient receives an offer, the owner may see redemptions without knowing whether the message changed behaviour.
A small control group, where operationally appropriate, helps separate natural return visits from campaign-driven activity. The comparison doesn't need a complex data science project. It needs a consistent definition and a record of what happened.
Practical rule: Every segment should have one owner, one next action and one outcome that can be reviewed.
A beauty business can assign staff responsibility for checking lapsed clients. A shop manager can review high-value customers before a seasonal promotion. A café supervisor can monitor whether a new reward causes repeat visits without creating queue confusion.
The data-driven loyalty strategies for boosting café repeat visits offer further context for translating customer behaviour into practical café activity. The important point is not to build dozens of segments. It is to create a small number that staff can recognise and serve consistently.
Implementation Considerations and Best Practices
A loyalty programme earns trust through clarity. Customers should know what information the business collects, why it collects it and how marketing consent works. UK GDPR and the Data Protection Act 2018 apply to loyalty-scheme tracking, and UK guidance summarised in loyalty-scheme analysis identifies explicit, freely given consent as the safest and most transparent basis for marketing tracking. Customers need to actively opt in, while pre-ticked boxes and consent bundled into terms and conditions aren't acceptable (UK loyalty-scheme compliance guidance).
Build the operating routine
A practical launch sequence looks like this:
- Define the decision: Choose the business problem, such as weak return visits or unused rewards.
- Select minimum data: Capture only the fields needed to measure that problem.
- Write the customer explanation: Use plain language at sign-up and separate service participation from marketing consent.
- Train the interaction: Give staff a short script and a clear process for scans, rewards and questions.
- Check data quality: Review duplicate profiles, missing visits and unusual redemption activity.
- Review and adjust: Set a regular meeting to decide what changes, rather than merely viewing a dashboard.
Prevent the common failures
Staff training matters because one missed scan can distort a customer's history and weaken a segment. Reward rules should also be easy to explain. If employees need to consult a long document at the till, customers will experience the programme as friction.
Data minimisation protects the business as well as the customer. An independent shop usually doesn't need to collect every possible personal detail to send a relevant visit reminder. Clear permissions, limited access and a defined retention process reduce unnecessary exposure.
Good analytics starts with good habits. A clean, modest dataset used consistently is more valuable than a large dataset nobody trusts.
Turning Insights into Action for Long-Term Success
The assumption that loyalty analytics requires an expensive data team is wrong for many small businesses. The core requirement is a repeatable loop: observe customer behaviour, choose an action, measure the response and adjust the programme.
Owners should review a focused scorecard at a regular interval. The review can ask whether inactive customers are returning, whether rewards encourage useful behaviour, whether staff follow the process and whether campaigns produce profitable visits. It should end with a decision, such as changing a reward, revising a message or removing a rule that creates friction.
The assumption that more points automatically create more loyalty is also weak. The 2024 UK consumer study surveyed 2,010 respondents nationwide between 12 June 2024 and 17 June 2024, and found that 73% said they were loyal to certain retailers, brands and stores. The same study reported that ethical loyalty rose 53% and true loyalty rose 93% between 2021 and 2024, indicating that loyalty measurement now needs to consider richer behaviour and values, not only repeat purchase (Customer Loyalty Index 2024 UK).
Customers also judge whether rewards feel useful. A 2026 UK summary reported that 57% of consumers felt frustrated when a programme took too long to deliver a usable reward, while 47% abandoned schemes when rewards felt low-value or irrelevant; the same source reported severe data-fragmentation problems among 91% of UK loyalty teams (UK loyalty programme statistics 2026). These figures reinforce a practical lesson: analytics should reduce customer friction, not add another layer of complexity.
For broader thinking on customer experience planning, the SupportGPT 2026 CX strategy provides useful context. A small business doesn't need to copy an enterprise model. It needs to connect trustworthy data to a timely action that customers can understand.
Business owners can begin by choosing one retention question, such as which members have stopped visiting or which rewards lead to another purchase. A QR-based loyalty workflow, clear consent language and a short monthly review can turn scattered activity into decisions without a complex POS project. Explore the available loyalty analytics approach, set up the first measurable customer journey and give staff one simple action to use on every relevant visit.


