
 Deutsch
 Español
 Français
 Italiano
 Magyar
 Polski
 Slovenčina
 Čeština
Loyalty segmentation is the practice of splitting your loyalty programme members into groups based on how they actually behave, not just who they are. The best first move is to run an RFM score (Recency, Frequency, Monetary value) across your customer base and turn the results into four to six actionable segments. RFM works as a starting point because it needs no predictive modelling, uses data almost every business already collects, and gives you campaign-ready groups within days rather than months.
TL;DR:
- Segment your loyalty members using RFM analysis, which requires only three data points per customer and provides actionable groups quickly.
- Focus on 5 to 10 segments, prioritizing those that contribute most to revenue and retention, rather than creating an excessive number of micro-segments.
- Regularly refresh RFM scores and automate segmentation updates to ensure campaigns target current customer behavior accurately.
- Use different models like lifecycle, behavioral, or value segmentation, layering these over RFM to add depth to your targeting.
- Connect segmentation to your campaign systems with tools that automate scoring, triggering, and reporting, especially for small teams aiming to act swiftly.
What is loyalty segmentation and why does RFM come first?
Loyalty segmentation means dividing your programme members into distinct groups based on their purchasing behaviour, engagement patterns, and value to your business, rather than treating every member the same way. It is different from general customer segmentation, which often relies on demographics or acquisition channel. Loyalty segmentation looks specifically at what members do inside the programme: how often they redeem, how recently they visited, and how much they spend.
The standard industry term for the foundational method is RFM analysis, and it remains the practical starting point for most teams building or rebuilding a loyalty strategy. Research applying RFM scoring to loyalty systems consistently identifies distinct clusters, including a “Best Customers” group and a “Lost Customers” group, each of which needs a completely different treatment plan to move the needle on retention and repeat purchase rates. You don’t need machine learning to see this pattern. You need three numbers per customer and a spreadsheet.
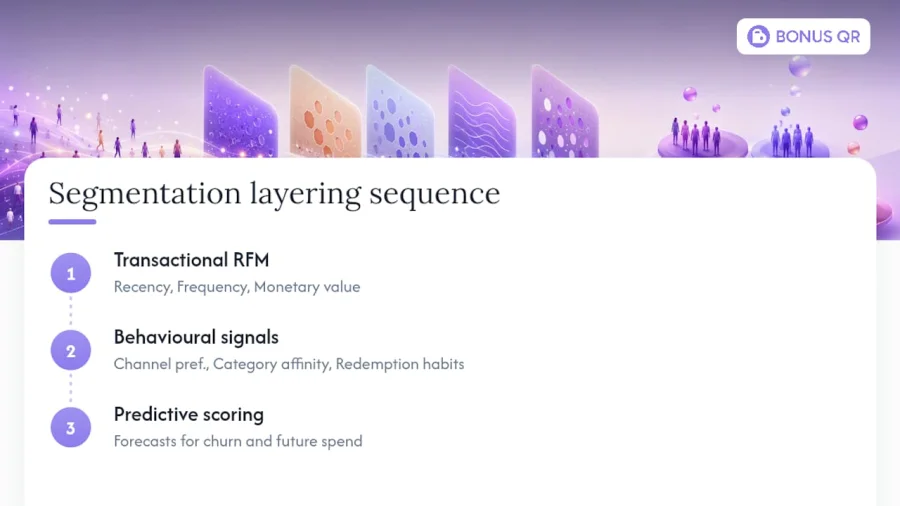
Once RFM segments exist, you layer on behavioural signals (channel preference, category affinity, redemption habits) and, later, predictive scoring. That sequence, transactional base first, behavioural overlay second, predictive layer third, is what separates programmes that ship real campaigns from ones stuck debating architecture for a quarter.
Why loyalty segmentation matters: business benefits and ROI
Segmentation earns its place in your roadmap because undifferentiated loyalty programmes waste budget on members who were never going to churn and under-invest in the ones who actually will. That is a retention strategy built to underperform.
The financial case rests on three effects:
- Retention lift: Segments let you target the specific members at risk of lapsing with a tailored offer, instead of blasting a discount to everyone and hoping the right people notice.
- Lifetime value growth: Identifying your highest-frequency, highest-spend members lets you protect their experience with recognition and tier perks rather than blunt discounts that erode margin.
- Marketing efficiency: Sending fewer, better-targeted campaigns to defined groups cuts wasted sends and usually improves open and redemption rates because the offer actually matches the customer’s stage.
Pro Tip: If you only measure one segmentation outcome in your first quarter, measure redemption rate by segment rather than overall programme redemption. Blended numbers hide the fact that your Champions segment might be redeeming at three times the rate of your Lapsing segment, and that gap is exactly what tells you where to spend next month’s campaign budget.
Industry analysis of loyalty programme segmentation points to five to ten actionable segments as the operational sweet spot for most teams, enough granularity to personalise meaningfully without creating more groups than your team can actually action. Go beyond that and you risk building segments nobody ever campaigns against, which is worse than not segmenting at all because it creates false confidence that your programme is more sophisticated than the results show.
The retention angle deserves particular attention because it is where segmentation pays for itself fastest; for actionable tactics on improving retention linked to segmentation, see how to increase customer retention. A member who visited five times last quarter and has gone quiet for six weeks is not the same problem as a member who never came back after their welcome offer. Bundling them into one “inactive” bucket means you send the wrong message to at least one of them. For a wider look at what moves retention numbers beyond segmentation alone, our guide on customer retention strategies covers the tactics that pair well with a segmented base.
How do you build loyalty segments step by step?
Building segments that actually drive campaigns follows a sequence. Skip a step and you end up with groups that look tidy in a spreadsheet but never make it into a live send.
-
Set the objective before touching data. Decide whether this segmentation round exists to cut churn, lift average order value, or improve marketing efficiency. Each goal changes which variables matter most. A churn-reduction objective weights recency heavily; a spend-growth objective weights monetary value and frequency.
-
Confirm the minimal data you need. You need three fields at minimum: last transaction date, transaction count over a defined window (usually 12 months), and total or average spend over that window. Pull these from your point-of-sale exports, loyalty platform database, or CRM. If you’re missing loyalty-specific fields entirely, your programme platform should be tracking these automatically rather than requiring manual exports.
-
Score each customer on Recency, Frequency and Monetary value. The simplest approach splits each dimension into quintiles (five bands, scored 1 to 5), giving every customer a three-digit RFM code. A customer scored 5-5-5 bought recently, buys often, and spends the most. A customer scored 1-1-2 hasn’t been seen in months, rarely bought, and spent little when they did.
-
Choose between rule-based bands and statistical clustering. Rule-based segmentation (defining fixed thresholds like “recency under 30 days = active”) is faster to implement and easier to explain to a marketing team. Statistical clustering, using an algorithm like K-Means to let the data define natural groupings, often surfaces boundaries a human wouldn’t guess, and combining K-Means with a classifier like XGBoost has been shown to improve loyalty prediction quality in e-commerce testing. For most teams starting out, rule-based bands on top of RFM scores are the pragmatic choice. Clustering earns its complexity once you have enough volume and a reason to trust an algorithm over a threshold.
-
Validate that your clusters are stable, not noise. This step gets skipped constantly, and it’s the reason so many segmentation projects quietly die after a few months. Run your clustering across multiple values of k (the number of clusters) and check metrics like silhouette score, the Elbow method, or Davies-Bouldin to confirm the groups you’ve found aren’t an artefact of one particular run. Published validation work on RFM-based clustering shows that silhouette and similar metrics give teams real confidence that segments will hold up when applied to new data, not just the sample used to build them. If your “Champions” segment shifts by 40% every time you rerun the model, it isn’t a segment yet.
-
Document each segment as a persona with a treatment plan. A segment without an assigned campaign is just a label. For each group, write down: the defining RFM code range or rule, the size of the group as a percentage of your base, the primary risk or opportunity it represents, and the specific offer, channel, and cadence you’ll use to treat it. This document becomes your team’s reference every time someone asks “why did this customer get this email?”
-
Prioritise segments by profitability, not size. Your largest segment is rarely your most valuable one. Rank segments by their contribution to revenue or margin, then allocate campaign budget and creative effort accordingly. A small VIP segment worth 30% of revenue deserves more attention than a large but low-spend segment that is cheap to reach but returns little.
Pro Tip: Run your first RFM pass on a rolling 12-month window, not all-time history. All-time data flatters dormant accounts that used to be great customers and buries recent shifts in behaviour under years of old transactions.
Core segmentation models: RFM, lifecycle, behavioural, value and predictive
Different models suit different stages of your programme’s maturity, and most mature programmes end up running several at once, layered rather than swapped out.
RFM segmentation remains the foundation for a reason: it’s fast, needs no specialist tooling, and maps directly onto business outcomes. The typical bucket structure splits each of the three dimensions into three to five bands. A common simplified version groups customers into Champions (high on all three), At-Risk (high monetary and frequency, but recency has slipped), New (high recency, low frequency by definition), and Lost (low across the board). Keep your bucket count small at first; five bands per dimension times three dimensions creates 125 theoretical combinations, far more than any team can action.
Lifecycle segmentation organises members by where they sit in the customer journey rather than by transaction scores alone: onboarding, active, at-risk of lapsing, lapsed, and win-back candidate. This model is particularly useful for automated flows, since it maps neatly onto trigger-based journeys. A new member who joined but hasn’t made a second purchase within 14 days triggers a different message than a member who lapsed after two years of regular visits.
Behavioural and engagement overlays add texture on top of RFM or lifecycle bases: preferred channel (app push versus email), category affinity, redemption behaviour (does this person save points or spend them immediately?), and response history to past campaigns. These overlays are where personalised marketing approaches genuinely start to feel personal rather than templated.
Value-based and tier-velocity segmentation matters most for programmes with a tiered structure. Rather than just current spend, tier-velocity tracks how fast a member is moving between tiers, which flags members at risk of demotion before it happens, and lets you intervene with a targeted push rather than losing a near-VIP over a technicality.
- Use RFM as your default base layer for any programme launching segmentation for the first time.
- Add lifecycle stages when you have automated email or push infrastructure ready to act on triggers.
- Layer behavioural overlays once you have at least six months of redemption history to draw on.
- Reserve tier-velocity tracking for programmes with defined tiers and real perks attached to them.
Predictive segmentation using machine learning is the layer to add last, not first. It needs a labelled history of churn or conversion outcomes to train against, a reasonably sized customer base, and someone comfortable validating model outputs. A layered stack approach, moving from transactional base to behavioural overlay to predictive surface, sets realistic expectations: predictive scoring adds precision on top of a working RFM foundation, it doesn’t replace the need for one.
Practical example: canonical segments and campaign playbooks
Turning models into action means defining specific, rule-based segments your team can build this week. Here is a working set that covers most retail, hospitality, and service loyalty programmes without over-engineering the split.
| Segment | Defining rule | Campaign idea | KPI to watch |
|---|---|---|---|
| Champions | Recency ≤ 30 days, Frequency in highest quintile, Monetary in highest quintile | Early access to new products or a surprise tier upgrade | Redemption rate, referral rate |
| At-Risk | Recency 60 to 90 days, historically high Frequency and Monetary | Personalised “we miss you” offer with a meaningful (not token) incentive | Reactivation rate within 30 days |
| Lapsing | Recency 90 to 180 days, moderate historical value | Win-back push with a limited-time double-points event | Click-through and return-visit rate |
| New | Joined within 30 days, one transaction or fewer | Onboarding sequence explaining how to earn and redeem, second-purchase nudge | Second-purchase conversion rate |
| Lost | Recency over several months, no response to prior win-back attempts | Low-cost reactivation email, then suppress from regular sends | Response rate, unsubscribe rate |
| Big Spenders (low frequency) | Monetary in highest quintile, Frequency in lower half | Frequency-building offer, such as a bonus for a second visit within 14 days | Frequency increase quarter over quarter |
Timing and channel choice matter as much as the offer itself. Champions respond well to app push and early-access framing because they already check the app regularly; At-Risk and Lapsing segments often need email or SMS since they’ve likely stopped opening push notifications. New members should get their onboarding sequence within the first 48 hours, while the sign-up experience is still fresh, not a week later once the goodwill has faded.
For smaller operators building out campaign ideas per segment for the first time, our retention playbooks for small businesses offer additional variations on the win-back and onboarding sequences above, and our notes on reward design for retailers go deeper on which reward types fit which value tier.
Data and tools: what you need before you can segment
You don’t need a data science team to run a first useful segmentation pass, but you do need three fields captured consistently: a unique customer identifier, transaction date, and transaction value, ideally linked to a loyalty account rather than an anonymous receipt.
The minimal schema pulls from your orders table or loyalty events log: customer ID, transaction timestamp, transaction amount, and where possible, a product category or location tag. If your loyalty platform tracks redemptions separately from purchases, pull that too. Redemption behaviour (does someone hoard points or spend them fast?) is a genuinely useful behavioural overlay once your RFM base is stable.
For tooling, match the approach to your team’s actual capability rather than what looks impressive:
- SQL or a spreadsheet handles RFM scoring for most small to mid-sized programmes; quintile scoring is a formula, not a model, and Excel or Google Sheets manages tens of thousands of rows without complaint.
- A managed loyalty platform with built-in segmentation removes the manual export step entirely, useful once you’re running campaigns weekly rather than quarterly.
- A CDP (Customer Data Platform) earns its cost when you’re unifying loyalty data with web behaviour, email engagement, and POS data across multiple systems, generally a mid-market or larger consideration.
- Clustering libraries (Python’s scikit-learn, or equivalent tools) become worthwhile once you have a genuine data analyst on staff and enough volume to make statistical clustering more accurate than rule-based bands.
Zero-party data, information customers volunteer directly through preference centres or onboarding surveys, adds a dimension that transaction history alone can’t reach: stated preferences, birthday dates, favourite categories. Industry guidance on segmentation notes that layering zero-party inputs on top of RFM can surface high-value groups that transaction data alone misses entirely.
One reminder that’s easy to skip in the excitement of building segments: US privacy expectations mean you should collect only what you’ll actually use, store customer data securely, and give members a clear way to see and control what you hold on them. This matters more as your segmentation gets more granular and starts to feel, to the customer, like you know a lot about them.
Measuring success: KPIs, holdouts and attribution
Segment-level KPIs tell you far more than blended programme metrics ever will, because they show you exactly where a campaign is working and where it isn’t.
Track these by segment rather than as one overall number:
- Retention rate: the percentage of a segment still active (transacting or engaging) after a defined period, typically 90 days.
- Redemption rate: the share of a segment that redeems an offer sent to them, a direct measure of relevance.
- Lifetime value uplift: the change in average spend per member within a segment, measured before and after a campaign.
- Churn risk score: for At-Risk and Lapsing segments specifically, track how many members move backward into Lost versus forward into Active.
To actually prove segmentation is driving these numbers rather than coincidence, run a holdout test: split each segment randomly, send your targeted campaign to one group and nothing (or your default generic send) to the other, then compare outcomes after a fixed window. This is the only reliable way to attribute uplift specifically to segmentation rather than to seasonal demand or a wider promotion running at the same time.
Pro Tip: Keep your holdout group at a minimum of a few hundred customers per segment where possible. Smaller holdouts produce results that look dramatic but are usually just statistical noise, and acting on noise erodes trust in segmentation faster than doing nothing at all.
Report at a monthly cadence for fast-moving segments like New and Lapsing, and quarterly for slower-moving ones like Champions, where meaningful shifts take longer to show up. Reading too much into a single week’s redemption dip is one of the more common mistakes teams make once they start segment-level reporting.
Operationalising segmentation: cadence, automation and governance
Segments that never get refreshed become stale faster than most teams expect, and stale segments actively mislead your campaigns rather than simply underperforming.
-
Refresh RFM scores monthly at minimum, weekly if your transaction volume supports it. Recency scores decay by definition, a Champion today drifts toward At-Risk within weeks of going quiet, so a segment built on last quarter’s data is already out of date.
-
Automate the recurring recalculation rather than running it manually each time. Most loyalty platforms and CDPs support scheduled scoring jobs; set one up once and let it run rather than relying on someone remembering to rerun a spreadsheet formula.
-
Build lifecycle journeys around segment transitions, not just static segment membership. A trigger that fires the moment a member moves from Active into At-Risk, rather than a scheduled monthly blast, catches the moment when intervention actually matters.
-
Establish naming conventions and ownership before you scale past five segments. One person or team should own the segment definitions document, and any change to a threshold or rule should go through a lightweight review rather than getting quietly edited by whoever touches the spreadsheet next.
-
Keep an experiment registry. Log every campaign tested against every segment, with results, so you’re not rerunning the same failed win-back offer against Lapsing customers every six months because nobody remembers it didn’t work last time.
The most common mistake teams make is over-segmentation: building fifteen or twenty micro-segments because the data technically supports it, then finding nobody has the capacity to build fifteen distinct campaigns. Guidance from segmentation practitioners is consistent here: start with three to five segments and only expand toward five to ten once automation is genuinely in place to handle the extra complexity. The second most common mistake is treating segment definitions as permanent; revisit your thresholds every quarter, because what counted as “high frequency” when your programme launched with 500 members looks different once you have 50,000.
Practitioner notes and platform fit for growing programmes
Segmentation only pays off once it connects cleanly to the systems that actually send campaigns, track redemptions, and report results back to you. That connection is where most in-house builds quietly stall, not at the analysis stage.
A loyalty platform built for this workflow typically maps onto the steps above in a few concrete ways:
- Automated RFM-style scoring replaces manual spreadsheet exports, so recency and frequency data stays current without someone rerunning a formula every month.
- Segment-triggered campaigns let you fire a win-back offer the moment a member crosses into At-Risk, rather than waiting for a scheduled send.
- Real-time analytics dashboards surface segment-level redemption and retention numbers directly, cutting out the manual reporting step that eats a surprising amount of a marketing manager’s week.
- Push notification and email tooling built into the same platform means your Champions segment and your Lapsing segment can receive genuinely different messages without juggling two separate systems.
For a small operator running a single loyalty programme with one or two staff managing it, a platform that handles scoring, segmentation, and campaign delivery in one place removes most of the technical overhead that would otherwise require a dedicated analyst. For a larger operation with an existing data warehouse and analytics team, platform tooling still accelerates the last mile, getting segment insight into an actual customer-facing message, even when the underlying scoring happens elsewhere. The roadmap doesn’t change based on team size; how much of it you build versus buy does.
Lessons from implementing segmentation at scale
The single biggest lesson from watching segmentation projects succeed and fail is this: the programmes that work aren’t the ones with the most sophisticated model. They’re the ones where someone actually builds a campaign against every segment within the first month. A beautifully validated six-cluster K-Means model that sits in a slide deck delivers nothing. A rough four-bucket RFM split with a live win-back email running against it delivers results within weeks.
Three things worth doing: start with fewer segments than feels satisfying, because five working segments beat fifteen theoretical ones every time. Validate your clusters before trusting them with budget, since an unstable segment sends the wrong message to the wrong people at scale. Measure with a genuine holdout, not a before-and-after comparison that conflates seasonality with your campaign’s actual effect.
Three things worth avoiding: don’t rebuild your entire segmentation scheme every quarter chasing marginal statistical improvement. Don’t let “at-risk” become a permanent label for someone who’s actually just lapsed; move people out of stale segments. And don’t wait for a perfect predictive model before you start; a working RFM split you can act on today beats a predictive pipeline you’re still validating in six months.
Treat segmentation as a cycle you revisit, not a project you finish. The moment you stop measuring which segments respond to which offers is the moment your “personalised” campaigns quietly become guesswork again.
— Michal
Getting your segmentation live with BonusQR
Most of the friction in loyalty segmentation isn’t the analysis, it’s connecting that analysis to a system that can actually send the right offer to the right group automatically. BonusQR is built around that exact gap: its platform features cover the scoring, segment automation, and analytics pieces this guide walks through, so you’re not stitching together a spreadsheet, an email tool, and a separate reporting dashboard to run what should be one workflow.
If you’re running a service business, BonusQR’s service-industry setup handles stamp cards, points, and tiered cashback with segment-ready automation from day one, no POS integration required. Hotels managing repeat-guest programmes can look at the hotel-specific loyalty tools for occasion-based rewards and tier tracking. And the analytics feature set gives you the segment-level redemption and retention numbers this guide recommends tracking, without a separate BI tool.
If you already run a data warehouse and a dedicated analytics team, some of this you’ll build in-house, and that’s a reasonable call. If you’re a small or mid-sized business trying to get segmented campaigns live without hiring a data analyst, register for BonusQR’s free tier and set up your first RFM-based segments this week.