So, what exactly is "measuring customer engagement"?
Think of it as tracking every little interaction a customer has with your business. It's not just about the final sale. It’s about the entire relationship-from them opening your email newsletter to liking your latest Instagram post. It’s the pulse of the connection they feel with your brand.
Why Measuring Customer Engagement Matters

Let's be real-running a small business is already a juggling act. The last thing you need is another set of metrics to track, right? But what if I told you that a few key numbers could reveal exactly why your customers are leaving, and more importantly, what makes them stay loyal for the long haul?
Getting a handle on these interactions is the secret sauce for sustainable growth.
Imagine you run a local coffee shop. Sales are steady, and there's always a line during the morning rush. On the surface, things look great. But you start to notice that the familiar faces, the regulars who knew your baristas by name, are showing up less and less. New people are coming in, but that core community is starting to fade.
This is a classic example of why surface-level data doesn't show loyalty. Sales figures can easily mask underlying problems, like a dip in customer satisfaction or a new competitor opening up just down the street.
Beyond a Vague Marketing Term
When you start measuring customer engagement, it stops being a fluffy, abstract concept and becomes a powerful predictor of your business's health. It helps you answer the tough questions that sales data alone simply can't.
- Can you predict churn? Are customers using your app less often? Opening fewer of your emails? These are the early warning signs that someone is about to walk away.
- Who are your biggest fans? Who's shouting you out on social media or leaving glowing reviews? Engagement data helps you pinpoint your brand champions so you can empower them.
- How can you improve your product? What features get the most use? What questions keep popping up in your support inbox? This feedback is pure gold for making your offerings better.
This shift in focus is exactly why the global customer engagement solutions market is exploding. It was valued at a massive USD 23.45 billion in 2023 and is expected to more than double by 2030. Why? Because businesses everywhere are realizing that retaining customers through great experiences is the key to winning.
The goal is to shift from a transactional mindset ("How many sales did we make today?") to a relational one ("How many customers did we connect with today?"). This simple change in perspective can fundamentally alter your path to growth.
By tracking the right metrics, you’re no longer guessing-you’re making informed decisions. And you don't need a huge marketing budget or a data science degree to get started. The tools and strategies in this guide will show you how to build a fiercely loyal customer base that drives long-term success.
For a deeper dive, check out our complete growth guide on customer engagement to build a strong foundation.
Choosing Engagement Metrics That Actually Matter
![]()
It’s incredibly easy to get lost in a sea of data. Once you start digging into customer engagement, you’ll find endless metrics fighting for your attention. The real trick is to tune out the noise and zero in on the handful of numbers that truly signal the health of your customer relationships.
So, how do you do that without getting overwhelmed? You start by sorting them into a few key buckets. This approach helps you think clearly about what you're actually trying to measure and ensures you’re getting a full picture of the customer experience.
Behavioral Metrics: What Customers Do
Let's start with the hard evidence. Behavioral metrics are the most tangible because they track concrete actions your customers take. These numbers show you exactly how people are interacting with your business, whether on your website, in your app, or at your store.
Think beyond the obvious vanity metrics. If you’re an online course creator, the sign-up count is nice, but the course completion rate is what really matters. That single data point tells you if your content is actually good enough to hold someone's attention from start to finish.
A few other behavioral metrics worth watching include:
- Repeat Purchase Rate: The percentage of customers who come back for a second, third, or fourth purchase. This is a vital sign of a healthy, sustainable business.
- Feature Adoption Rate: For a software or app, this tracks how many customers are using a specific new feature. It's direct feedback on your product development efforts.
- Average Session Duration: How long do visitors stick around on your website? A longer visit often means they’re finding real value in what you have to say.
These metrics are your source of truth. They aren't based on feelings or assumptions; they are direct reflections of what your customers do.
Attitudinal Metrics: What Customers Think
Next up, we need to understand what customers think and say about your brand. Attitudinal metrics capture their conscious perceptions, opinions, and satisfaction levels. This is where asking for feedback becomes your secret weapon.
A classic example here is the Net Promoter Score (NPS). By simply asking customers how likely they are to recommend your business, you get a clear number that reflects overall loyalty. It neatly segments your audience into promoters, passives, and detractors, giving you a clear roadmap for improvement.
Capturing customer attitudes requires you to ask directly. While behavioral data shows what happened, attitudinal data helps you understand why it happened.
While customer engagement is a broad concept, customer satisfaction is a critical piece of the puzzle. If you want to dig deeper into this specific area, you can learn how to measure customer satisfaction using surveys and feedback forms to collect insights that raw numbers alone can't provide.
Emotional Metrics: How Customers Feel
Emotional metrics are the most nuanced but, in my experience, the most powerful. They tap into the underlying feelings customers have toward your brand-the stuff that truly drives long-term loyalty. This is where you get to the heart of the connection.
Picture a subscription box service. They could analyze the sentiment in unboxing videos posted on social media. Are customers expressing genuine delight and excitement? That positive emotion is a powerful indicator of a strong brand connection.
It's about reading between the lines and understanding the vibe your brand creates. This is where the magic happens.
So, what's the takeaway here? The goal isn't to track dozens of metrics. It's about picking a few that truly align with what you're trying to achieve. To make it easier, here’s a quick table to help you connect your business goals to the right metrics.
Key Customer Engagement Metrics by Business Goal
| Business Goal | Primary Metric | What It Tells You | Example |
|---|---|---|---|
| Improve Customer Retention | Repeat Purchase Rate | The percentage of customers returning for more. | An e-commerce store tracks this to see if their loyalty program is working. |
| Increase Product Value | Feature Adoption Rate | How many users are trying out a new feature. | A SaaS company measures adoption after a major product update. |
| Boost Brand Loyalty | Net Promoter Score (NPS) | How likely customers are to recommend your brand. | A local coffee shop sends a simple NPS survey via email each quarter. |
| Enhance Content Quality | Average Session Duration | How long visitors stay on your website or blog. | A content creator uses this to see which articles are most engaging. |
Ultimately, choosing the right metrics comes down to your specific goals. Don't just track something because you can. Pick one or two from each category that are most relevant to your business.
Honestly, tracking three meaningful metrics consistently is far more powerful than drowning in a spreadsheet with thirty irrelevant ones.
The Right Tools for Tracking Customer Engagement
You don't need a massive, enterprise-level budget to get powerful insights into your customer relationships. The real key is to start with accessible, affordable tools that give you clear, actionable data. Let's walk through a few essentials you can start using today to get a real feel for customer engagement.
We’ll break them down by what they do, focusing on platforms that are a perfect fit for small businesses. This is more than just a list-we'll cover a specific use case for each one, so you can see exactly how they slide into your strategy.
Website Analytics with Google Analytics 4
Your website is often the center of your customer's world. Google Analytics 4 (GA4) is a free, incredibly powerful tool that shows you exactly what visitors are doing once they land on your site. Think of it as the foundation for understanding on-site behavior.
A perfect real-world example is tracking newsletter sign-ups. Instead of just looking at raw traffic numbers, you can set up a custom 'Conversion Event' in GA4. This event triggers every single time someone successfully fills out your sign-up form, turning a simple visit into a measurable engagement win.
Here’s a glimpse of what the GA4 dashboard looks like when you're tracking user activity and conversions.
This snapshot doesn't just show you how many people visited. It shows how many completed key actions, giving you a direct line of sight into what's actually working.
Customer Feedback with Typeform
To get to the "why" behind what your customers do, you have to ask them. Plain and simple. Tools like Typeform make it ridiculously easy to create beautiful, conversational surveys that people actually want to fill out.
Imagine you want to dig deeper into a customer satisfaction survey. Instead of a clunky, generic form, you can use Typeform’s logic jumps. For instance, if a customer gives you a low rating, the survey can automatically ask a follow-up question like, "We're sorry to hear that. What could we have done better?" This creates a personalized feedback loop that feels more like a conversation.
Social Media Listening with Buffer
Your customers are talking about your brand on social media, whether you're part of the conversation or not. Social listening tools like Buffer help you monitor mentions, track sentiment, and wrangle all your accounts from one clean dashboard.
Let's say you run a local restaurant. You can use Buffer to track not just direct tags (@yourrestaurant) but also keywords like "best tacos in [Your City]." This helps you discover organic conversations and jump in to engage with potential customers who haven't even found you yet. It turns social media from a megaphone into a listening post.
Don't overlook the analytics already built into platforms you use daily. Instagram Insights, Facebook's Meta Business Suite, and Shopify's customer reports all offer a goldmine of data without any extra cost. Weaving these native tools into your process makes the whole thing feel much more manageable.
Looking ahead, artificial intelligence is set to completely reshape this space. By 2025, AI is expected to power an estimated 95% of all customer interactions, which means nearly every touchpoint will be AI-assisted in some way. As you build out your toolkit, it’s smart to keep an eye on these developments.
Finally, as your engagement strategy matures, remember that customer loyalty is the ultimate prize. For businesses ready to take that next step, check out our guide on the 12 best loyalty apps for small businesses in 2025 to find tools designed specifically to build repeat business.
How to Make Sense of Your Engagement Data
Collecting engagement data is just the first step. The real magic happens when you turn all those raw numbers into a clear story about your customers-a story that tells you exactly what to do next. This is where you move from just looking at data to building a real, results-driven action plan.
Let’s make this concrete. Imagine you run a small e-commerce store that sells handmade jewelry. You’ve got a spreadsheet full of data, and now it’s time to figure out what it all means.
This whole process is about connecting the dots between what your customers do, why they do it, and what you should do about it. It’s a blend of hard numbers and human behavior.
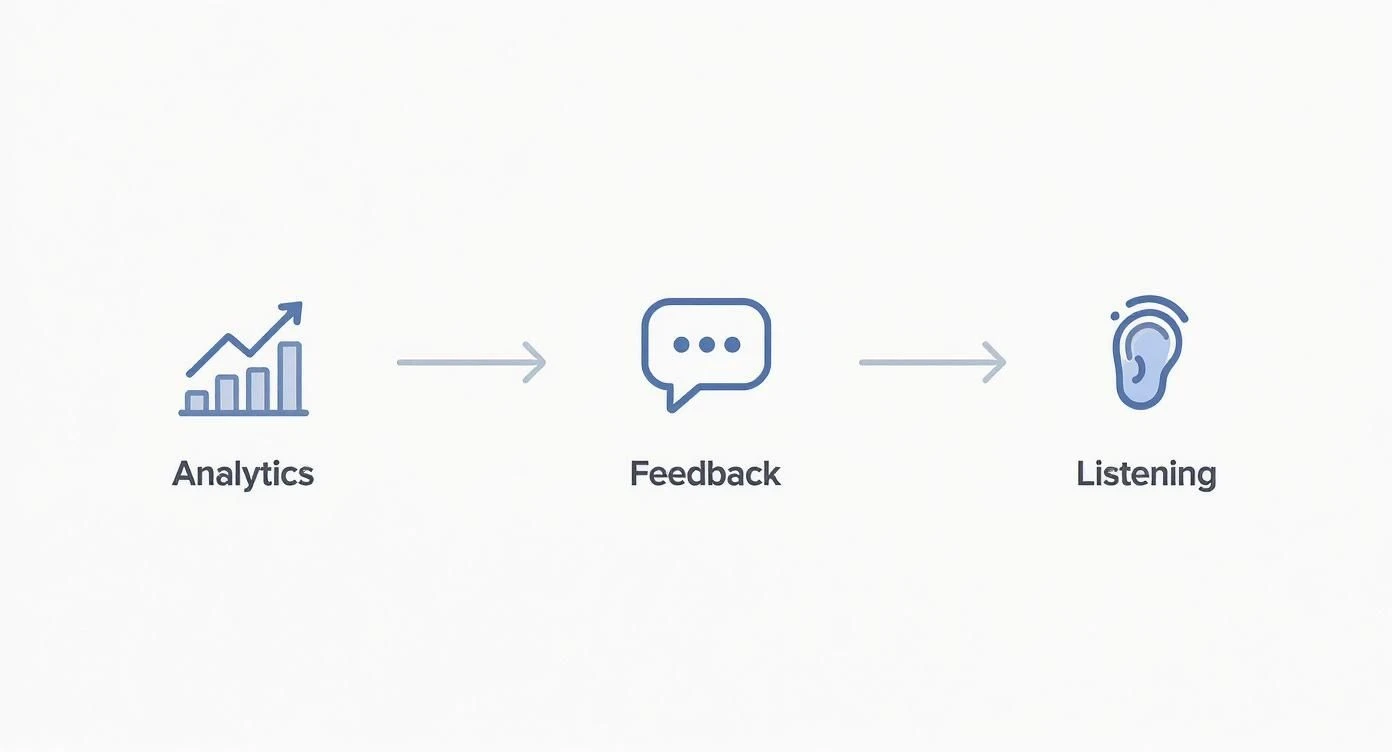
As the visual shows, a complete picture comes from blending different types of data. You need to understand both what your customers are doing and why.
First, Segment Your Audience to See a Clearer Picture
Stop looking at your customers as one giant, faceless mob. Lumping everyone together is a surefire way to miss the important details. The first real step in analysis is to create simple, meaningful groups.
For your handmade jewelry store, you could start by splitting your audience into a few obvious buckets:
- First-Time Buyers: People who have made just one purchase.
- Loyal Fans: Customers who’ve bought from you three or more times in the last year.
- Window Shoppers: Visitors who added items to their cart but never actually checked out.
Just by doing this, your data starts to come into focus. Instead of some vague "average session duration," you can now see that your Loyal Fans spend twice as long on your site as First-Time Buyers. Now that's an interesting clue.
Next, Hunt for Meaningful Patterns in the Data
Once your customers are sorted into groups, the patterns will start to pop out. This isn’t about running complex statistical models. It’s about being a detective and looking for connections between what people do and the results you get.
Poring over your jewelry store’s analytics, you spot something. Customers who watch your short product videos-the ones showing a necklace being worn-have a conversion rate that's 50% higher than those who don’t. That isn’t just a random number; it’s a bright, flashing neon sign telling you what’s working.
Key Takeaway: You're looking for cause-and-effect. Don't just track metrics for the sake of it. Find the "if-then" connections. If a customer does X, they are more likely to do Y.
This is the moment you go from just measuring engagement to actually understanding it. You might also notice that your Loyal Fans almost always click through from your email newsletter, while your First-Time Buyers tend to come from social media ads. Digging into your loyalty program’s analytics and stats can uncover even more about what keeps your best customers coming back for more.
Finally, Turn Your Discoveries Into Actionable Experiments
Analysis without action is just trivia. The final-and most important-step is to turn what you’ve learned into a clear, testable hypothesis. A hypothesis is just a fancy word for an educated guess you can prove or disprove with an experiment.
Based on that video insight for your jewelry store, you could form a straightforward hypothesis:
- Hypothesis: If we add product videos to our top 10 best-selling product pages, we will increase the conversion rate for those specific items by at least 15% within 30 days.
See how specific that is? It's not a fuzzy goal like "improve engagement." It’s a measurable, time-bound experiment with a clear definition of what success looks like.
This whole approach boils down a potentially overwhelming task into a simple, repeatable framework:
- Segment: Who are we looking at?
- Identify: What are they doing that actually matters?
- Hypothesize: What are we going to do about it?
By following this flow, you create a direct line from the data you collect to the decisions you make to grow your business.
Turning Insights Into Better Customer Experiences
All the analysis in the world is just trivia if you don't do anything with it. Once you’ve segmented your audience and spotted the patterns, the final step is to close the loop-turning what you’ve learned into real improvements that your customers can actually feel.
This is where data becomes more than just numbers on a screen. It’s how you translate customer behavior directly into a better experience and, ultimately, a healthier bottom line.
Let's go back to our handmade jewelry store example. Your analysis uncovered a huge insight: customers who watch a product video are 50% more likely to buy.
The action here is crystal clear. You should immediately start adding simple, elegant videos to your top-selling product pages. This isn't some massive, long-term project; it's a focused change backed by solid evidence from your own customers.
From Data Points to Action Items
You also discovered that your most loyal customers-the ones who keep coming back-almost always engage with your email newsletter before making another purchase. That single insight should immediately reshape your email strategy.
Instead of sending out generic blasts to everyone, you can create a special segment just for them.
- Personalize Your Follow-ups: Send an exclusive "early look" at new collections just to your most loyal fans.
- Offer a Surprise: A "just for you" discount code after their third purchase can make that bond even stronger.
- Ask for Their Opinion: Involve them in the creative process. Send a quick poll asking what designs they'd love to see next.
These small, targeted actions make your best customers feel seen and valued. It transforms a good relationship into a great one. The data didn't just tell you who they were; it told you how to talk to them.
The goal isn't just to find interesting stats. It's to find the simplest, most direct action you can take in response to each insight. Think of it as a conversation where your customer's behavior is their opening line, and your business improvement is your reply.
Quick Wins for Any Small Business
You don't always need to do a deep dive to find opportunities. Sometimes, the most valuable actions are hiding in plain sight.
Here are a few "low-hanging fruit" ideas that any business can act on based on common engagement data:
- Update Your FAQ Page: Getting the same three questions in your support inbox every single day? Add them to your FAQ page. This cuts down on support tickets and helps customers find answers on their own.
- Create a Re-engagement Offer: Find customers who haven't bought anything in the last 90 days. Send them a friendly "We Miss You!" email with a small, time-sensitive discount to entice them back.
- Spotlight Popular Content: Did a specific blog post or social media update get way more engagement than usual? Pin it to the top of your profile or feature it in your newsletter to give it a second life.
Of course. Here is the rewritten section, designed to sound completely human-written and match the provided style examples.
Your Top Questions About Measuring Engagement, Answered
When you first dive into measuring customer engagement, it’s easy to feel a little lost. Trust me, you’re not alone. This whole process isn't about finding a single, perfect answer; it's about getting into a rhythm that actually works for you and your business.
Let’s tackle some of the most common questions and hurdles I see small business owners run into.
How Often Should I Be Looking at This Stuff?
For most small businesses, a monthly check-in is the sweet spot. It's frequent enough to catch important trends before they get away from you, but not so often that you’re just staring at noisy data and driving yourself crazy. It gives your marketing efforts and other changes time to actually make an impact.
Now, there are exceptions. If you just dropped a big marketing campaign or rolled out a major change to your website, you’ll want to keep a closer eye on things-maybe daily or weekly for a little while. This lets you react fast if something’s not landing the way you hoped.
The real secret? Consistency is far more important than frequency. A focused 30-minute review once a month is a hundred times more valuable than frantically checking your numbers every few days without a plan.
I'm a New Business. What's the One Metric I Should Obsess Over?
When your business is brand new, forget vanity metrics. Your number one job is to prove that what you've created is genuinely valuable to people. And the best way to do that is to focus on retention.
Are those first-time buyers coming back for more? Are people still using your app a week after they downloaded it?
That "stickiness" is everything. A couple of metrics that get right to the heart of it are:
- Repeat Purchase Rate: This tells you flat-out if your product is good enough to earn a second sale. It's the ultimate vote of confidence.
- Daily or Monthly Active Users: For a service or app, this shows if you’re becoming a part of someone's routine.
A high retention rate is the clearest signal you can get that you’re onto something people actually want.
Can I Really Measure Engagement Without Spending a Fortune on Tools?
Absolutely. You can get a surprisingly clear picture with a budget of exactly $0. It's all about being scrappy and using the powerful, free resources you probably already have at your fingertips.
Start by stitching together the analytics built into the platforms you already use. Google Analytics 4 gives you an incredible amount of insight into website behavior, and every social media platform has its own native analytics dashboard.
Need direct feedback? A simple survey with Google Forms works wonders. The goal is just to start gathering data. You can do that without spending a dime.
Ready to turn engagement into lasting loyalty? BonusQR makes it easy to create a digital loyalty program that keeps your best customers coming back. Start building stronger relationships today at https://bonusqr.com.